
1
21 Climate Change
Questions
What is causing climate change?
How much will global temperature increase?
By David A. May
Comments@myclimatequestions.com
©2023
May be reproduced.
with attribution.
I was a believer of the CO2 climate emergency thesis —
even before the crusade picked up steam. Now I am a
climate questioner. Must we overturn our lives or face
catastrophe?
Preface
I became a “climate questioner” after I wagered a costly meal with a
British climate skeptic — and lost.
It was 2016, and CO2 levels and temperatures had been rising every
year. Global warming will continue, I wagered, and within 5 years
will exceed the high temperature of 2016. However, global
temperature dropped significantly. I had to understand why.
My background: I grew up in the suburbs of St. Louis, Missouri (the
show-me state), and briefly in a small New Mexico town. Even as a
teen-ager I read original science texts. I attended liberal Harvard
College and then conservative Harvard Business School. To “help the
world” I studied population growth in Africa and India, and with help
from Harvard I published a journal article used in university teaching
for decades afterward — showing that the number of children per
family was a matter of choice, not lack of means to plan families.
Later, using “appropriate technology” I set up an ice factory in West
Africa that remarkably survives to this day, many decades later,
under African management. In the USA, I manufactured energy

2
conserving window treatments and with my wife brought up two fine
children.
Click here for the Executive Summary — Read my conclusions
without the data, explanation, and reasoning.
If you wish only to read parts of this exploration, the
following is a list of my questions with links:
Could the presently accepted truth be wrong? _______________________________3
My first question: How rapidly has the climate been warming? ____________4
My second question: When climate skeptics doubt the temperatures used
to calculate warming, are they correct?_______________________________________4
My third question: Is the earth warming because we are still coming out
of the Ice Age? __________________________________________________________________5
My fourth question: Could a natural fluctuation explain current world
temperature changes?__________________________________________________________6
My fifth question: Are the impacts of climate warming thus far as bad as
they have been portrayed?_____________________________________________________8
My sixth question: How large are the recent fluctuations in worldwide
temperature?____________________________________________________________________9
My seventh question: Are solar fluctuations warming the climate? ______12
My eighth question: Is the heat that comes up through the crust of the
earth (not considering plumes and volcanos) affecting the climate?______14
My ninth question: Are Land Volcanos affecting the temperature? _______14
My tenth question: Are Undersea Volcanos and magna plumes partly
responsible for present climate and climate change? ______________________16
My eleventh question: Are fluctuations in winds and ocean currents
sufficient to affect average global temperatures? __________________________18
My twelfth question: Has deforestation caused the climate to warm? ___21
My thirteenth question: What are the effects of human-caused aerosol
emissions into the air? ________________________________________________________24
Fourteenth question: Why and how do greenhouse gases affect the
earth’s temperature?__________________________________________________________28
My fifteenth question: What effect do individual greenhouse gases have
on temperature? _______________________________________________________________33
My sixteenth Question: How much are fluctuations in Ozone affecting the
climate? ________________________________________________________________________35

3
My seventeenth question: What about future warming from methane?__38
My eighteenth question: What has been the warming effect of carbon
dioxide (CO2)? _________________________________________________________________44
How fast has carbon dioxide (CO2) been increasing? When will it double
from the 1850 level? __________________________________________________________46
My nineteenth question: How has the IPCC predicted future
temperatures? _________________________________________________________________49
My twentieth question: Can we measure climate change forcings and
sensitivity accurately enough to prove anything? __________________________57
My twenty-first question: What will the world’s average temperature be
in 2090? ________________________________________________________________________59
What are my conclusions? ____________________________________________________60
Could the presently accepted truth be wrong?
In my lifetime, widely promoted scientific crusades have been
proven false and harmful: For example, the entire medical
profession crusaded against cholesterol and then, again, against
all fat. Many fats, however, promote health and the switch to
sugar caused diabetes to soar. Doctors crusaded to prescribe
statins to young, healthy, adults with low cardiac risk, who then
had a higher chance of muscle malfunction and of dying from all
causes.
Throughout history scientific errors have taken place, in physics,
chemistry, biology and medicine. Doubting practitioners
generally don’t raise questions against crusades, because
careers and livelihoods are involved.
1
At the time of this writing
those who question the climate crusade, or other present-day
crusades, are often subject to attack and inability to find
positions.
In a sphere much simpler than climate — stocks — 94 percent of
experts, after 20 years — often with their massive data and
complex models – have underperformed markets, usually
substantially. And concerning climate, previous predictions of
1
The definitive book on this, published originally in the 1962 and still available is “The
Structure of Scientific Revolutions” by Thomas S. Kuhn

4
the international climate authority, the IPCC, have been very
wrong.
On the other hand, the arguments of deniers — those who deny
that humans are causing climate change — are often based
upon selective data and false assumptions. Below is my
dispassionate look at the science.
My first question: How rapidly has the climate been
warming?
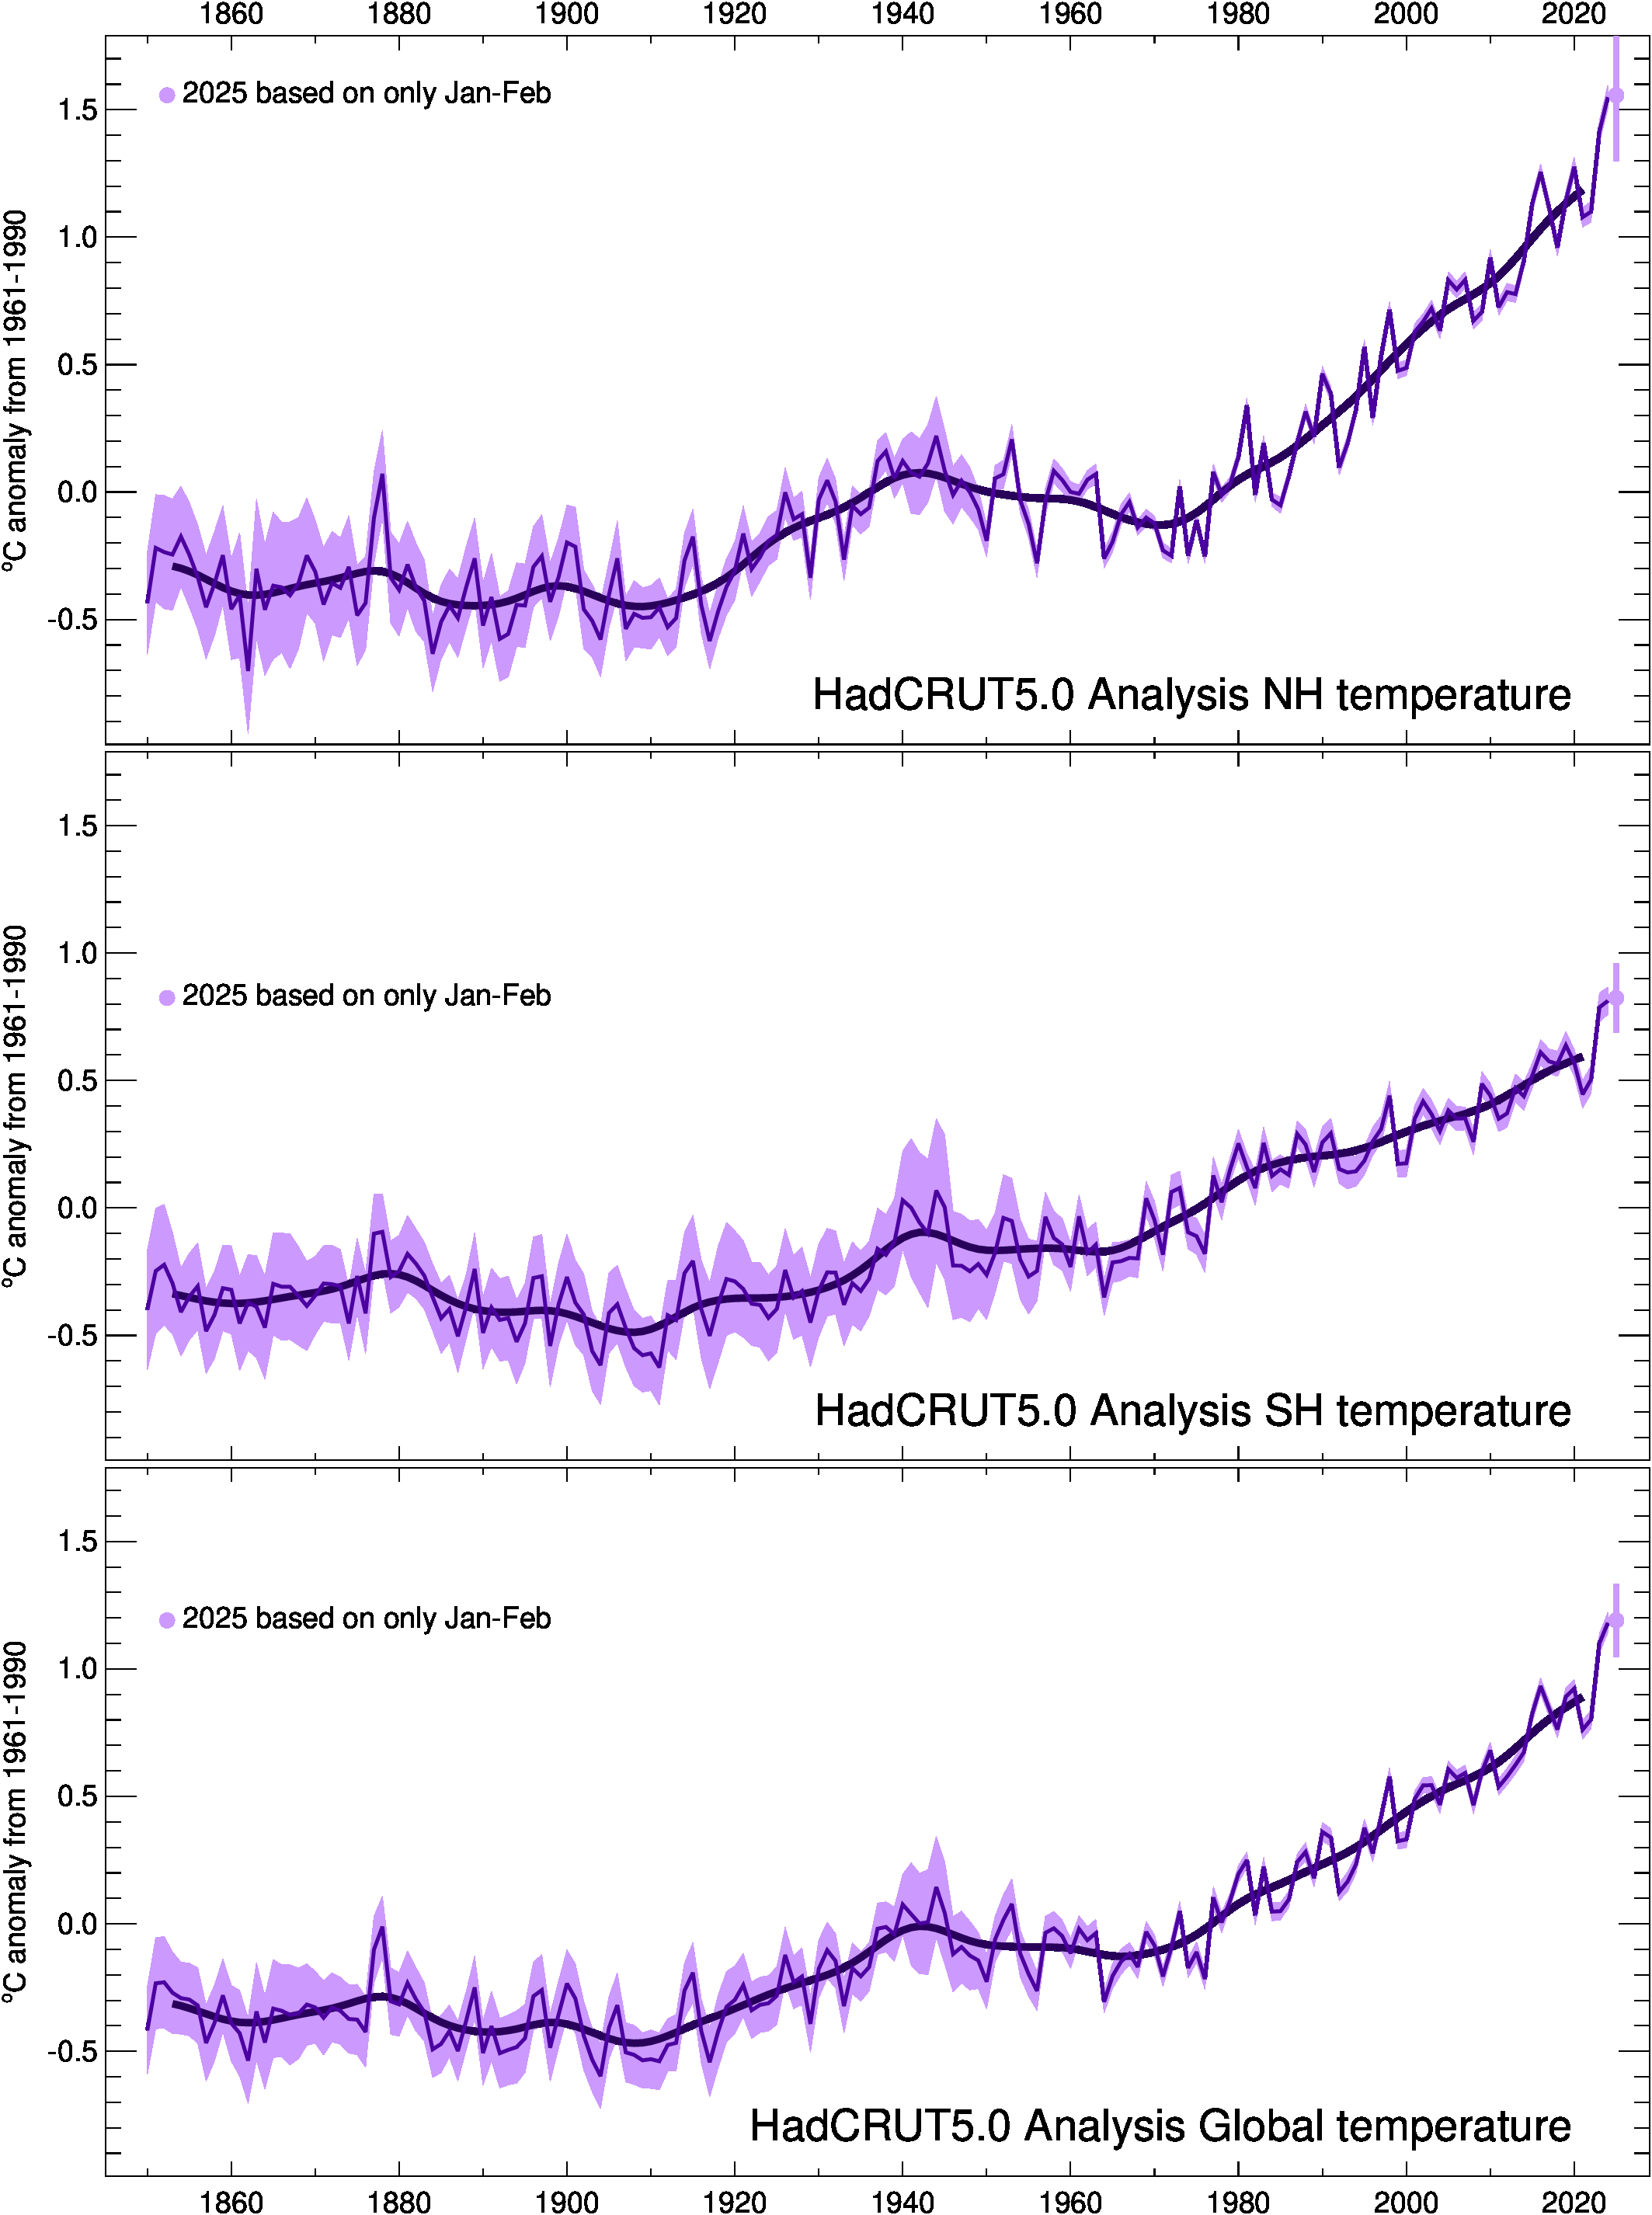
There is no doubt that global lower-atmosphere
temperatures have risen about 0.5ºC from 1850 to 1980
— 130 years — and approximately another 0.5ºC or 0.6ºC
from 1980 to 2022
2
3
4
— 42 years.
5
Temperatures have
increased about fifty percent more than the global average over
North America and Europe, but temperatures have risen less
than the average in the tropics and the southern hemisphere.
Temperatures over land rise faster than temperatures over
ocean because land absorbs heat more easily.
As I write in June 2023 averaged (last 13 months)
temperatures worldwide have fallen about 0.2ºC from
their all-time (2016) highs, especially since 2020.
6
This
may have been caused by an unusually long La Niña after a very
strong El Niño and a very slight downturn in solar radiation. Is
this just a temporary downward swing before another rise back
towards the levels of 2016 or even above? The evidence from
the oceans and recent trends suggest that it is.
I believe, having completed my questions as I write this,
that temperatures will continue to increase, but at a rate
2
https://www.ncei.noaa.gov/access/monitoring/climate-at-a-glance/global/time-
series/globe/land_ocean/ann/12/1880-2022
3
https://crudata.uea.ac.uk/cru/data/temperature/HadCRUT5.0Analysis_300.png This data fills
the period from 1850 to 1880.
4
See the graph and data since 1980 at https://www.drroyspencer.com/latest-global-
temperatures/ and reproduced in this paper below.
5
If one cherry picked the period 1979 to 2016 it rose 1ºC, but temperatures were higher before
1979 and have declined since the all-time high in 2016.
6
See the graph and data since 1980 at https://www.drroyspencer.com/latest-global-
temperatures/ and reproduced in this paper below.

5
far below the highly publicized, scary IPCC predictions.
Read on to see what you think.
My second question: When climate skeptics doubt the
temperatures used to calculate warming, are they correct?
Are the published land temperatures biased — as some climate
skeptics believe? Yes, published land surface
temperatures are overstating the temperature increase
of the earth’s surface by about 0.1ºC. Here’s why: Most
weather stations are located in urban heat islands that have
often doubled, tripled, or more in size in the last century
7
8
It is
common knowledge that it is warmer in a big city than in a small
town or in the countryside. Urban areas, however, contain less
than one percent of the world’s land areas. Furthermore, many
non-metropolitan weather stations are considered unreliable,
and given less weight in averages or ignored.
For this reason, in this paper, for years since 1979, I use the
satellite temperatures of the atmosphere near the ground
maintained for NASA by the University of Alabama Huntsville.
(Satellite temperatures are not direct readings but are
calculated from radiation in the atmosphere near the ground.
(Some skeptics also question the accuracy and consistency of
the instruments on the satellites, and of the conversions to
temperatures, but I have seen no evidence for this.)
9
For years before 1979, of necessity I will use temperatures
measured on land and at sea. This temperature record is highly
questionable but nothing better is available. Measuring
techniques have changed and climate station have moved to
hotter locations. Scientists adjust the temperatures to what
they think they think accounts for this, and these adjustments
are ongoing and non-verifiable. Prior to 1800 few weather
7
Surface based temperature increases are almost entirely dependent on weather stations in
cities, which are much more numerous and much more reliable. Urban areas, however, make
up only 1% of the earth’s land area. Most urban areas with reliable weather data have grown
exponentially in population and building size since 1850. Buildings are heated in winter and
air conditioned (which adds heat on balance) in summer.
8
Research quantifying the discrepancy in several cities has been published in the Blog by Dr.
Spencer at https://www.drroyspencer.com
9
Satellite-measured temperatures often lag ground and sea surface temperatures by two or three
months.

6
station locations existed. Temperatures before the renaissance
are based upon ice cores, tree rings, and similar evidence.
My third question: Is the earth warming because we are
still coming out of the Ice Age?
Before this research I thought that a very long thawing
explained some of current global warming. I was mostly wrong.
The last ice age maximum cooling ended about 12,000 years
ago, and the warming from that ended about 6,000 years ago.
10
I was not completely wrong because the Antarctic glaciers and
sometimes the Greenland glaciers have been diminishing ever
since the Ice Age, and in analogy with an ice chest almost out of
ice, this can cause somewhat accelerated warming.
Current studies indicate that changes in CO2 levels have
generally lagged the start and end of ice ages. Scientists now
think that CO2 changes followed the onset and end of ice ages.
Some think that the CO2 amplified the swings, others that it is a
symptom of them.
11
All agree that the ice ages were initiated
by changes in the earth’s orbit and inclination, and also ended
by these, or perhaps by geothermal events.
My fourth question: Could a natural fluctuation explain
current world temperature changes?
10
Milankovitch’s explanations of how changes in the earth’s orbit around the sun, its tilt, and
its precession (top like motion) cause ice ages and their opposite are now accepted by everyone,
though there are some tweaks still to be made. Global temperatures have remained within a
small range for thousands of years until recently warming.
11
https://www.carbonbrief.org/explainer-how-the-rise-and-fall-of-co2-levels-influenced-the-
ice-ages/ This includes a good discussion of the issues, but its conclusion is
not proven in my opinion.
7
The following data sources were used in constructing the main plot:
1. (dark blue) Sediment core ODP 658, interpreted sea surface temperature,
Eastern Tropical Atlantic: M. Zhao, N. A. S. Beveridge, N. J. Shackleton, M.
Sarnthein, and G. Eglinton. "Molecular stratigraphy of cores off northwest
Africa: Sea surface temperature history over the last 80
ka". Paleoceanography 10 (3): 661-675. doi:10.1029/94PA03354
2. (blue) Vostok ice core, interpreted paleotemperature, Central
Antarctica: Petit J. R., Jouzel J., Raynaud D., Barkov N. I., Barnola J. M.,
Basile I., Bender M., Chappellaz J., Davis J., Delaygue G., Delmotte M.,
Kotlyakov V. M., Legrand M., Lipenkov V., Lorius C., Pépin L., Ritz C.,
Saltzman E., Stievenard M.. "Climate and Atmospheric History of the Past
420,000 years from the Vostok Ice Core, Antarctica". Nature 399: 429-
436.doi:10.1038/20859
3. (light blue) GISP2 ice core, interpreted paleotemperature,
Greenland: Alley, R. B.. Quaternary Science Reviews. doi:10.1016/S0277-
3791(99)00062-1
4. (cyan) Kilimanjaro ice core, δ
18
O, Eastern Central Africa: Thompson, L. G.,
E. Mosley-Thompson, M. E. Davis, K. A. Henderson, H. H. Brecher, V. S.
Zagorodnov, T. A. Mashiotta, P.-N. Lin, V. N. Mikhalenko, D. R. Hardy, and
J. Beer. "Kilimanjaro Ice Core Records: Evidence of Holocene Climate
Change in Tropical Africa". Science 298 (5593): 589-
593. doi:10.1126/science.1073198
5. (yellow) Sediment core PL07-39PC, interpreted sea surface temperature,
North Atlantic: Lea, D. W., D. K. Pak, L. C. Peterson, and K. A. Hughen
(2003). "Synchroneity of tropical and high-latitude Atlantic temperatures
over the last glacial termination". Science 301 (5638): 1361-
1364.doi:10.1126/science.1088470

8
6. (orange) Pollen distributions, interpreted temperature, Europe: B. A. S.
Davis, S. Brewer, A. C. Stevenson, J. Guiot (2003). Quaternary Science
Reviews 22: 1701-1716. doi:10.1016/S0277-3791(03)00173-2
7. (red) EPICA ice core, δDeuterium, Central Antarctica: EPICA community
members (2004). "Eight glacial cycles from an Antarctic ice
core". Nature429 (6992): 623-628. doi:10.1038/nature02599
8. (dark red) Composite sediment cores, interpreted sea surface
temperature, Western Tropical Pacific: L. D. Stott, K. G. Cannariato, R.
Thunell, G. H. Haug, A. Koutavas, and S. Lund (2004). "Decline of surface
temperature and salinity in the western tropical Pacific Ocean in the
Holocene epoch". Nature 431: 56-59. doi:10.1038/nature02903
12
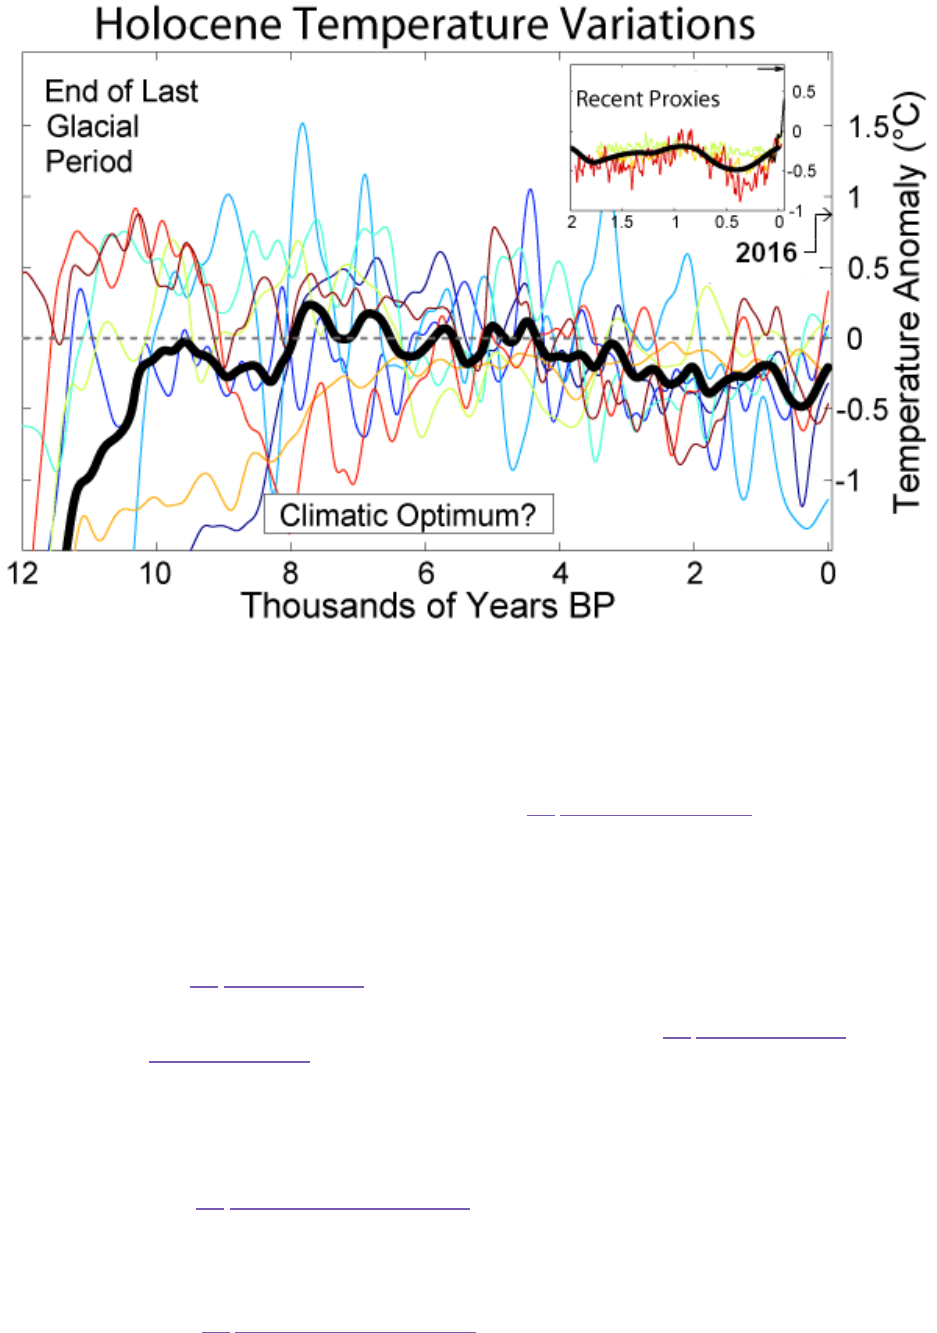
In the last 2000 years the world may have been slightly warmer
or as equally warm as today; notably during the Roman and
Medieval Warm Periods in Europe. Given the huge range of
variations from the different temperature reconstructions in the
graphic above, these may or may not have been regional
fluctuations and not worldwide. In the prior 6,000 years, it is
probable that temperatures did equal or exceed those of today.
The clearest examples of periods that could have been warmer
than today occurred 5000 to 8000 years ago — the period
during which farming arose and the Egyptian, Mesopotamian,
Indus and Minoan civilizations flourished.
What world temperature history does show is: 1) that
there have been regional changes of several degrees
Celsius that have lasted for centuries; and 2) that in the
pre-industrial era world temperatures have fluctuated by
at least 0.5ºC, and probably more than 1.0ºC.
Therefore, we cannot rule out natural events as cause for
some of recent temperature increases.
My fifth question: Are the impacts of climate warming thus
far as bad as they have been portrayed?
My research indicates that many misstatements and
even misleading photographs and movies have been
publicized — often, it seems, deliberately to scare people
into action. For example, hurricanes are not worse than
before. Tornadoes are not worse than before. Most coral reefs
12
https://en.wikipedia.org/wiki/File:Holocene_Temperature_Variations.png

9
that were bleached by ocean hot spots have recovered
13
, and
coral bleaching and recovery have occurred many times before.
Reservoirs and ground water in arid areas of the American West
have not been receiving less precipitation than during other dry
periods (but are being drained by overuse). The dust bowl era
of the 1930s was more extreme than recent heat and drought.
The western Antarctica ice shelf is melting due to warm ocean
temperatures, but the interior of Antarctica has been getting
colder.
14
Every climatological record or unusual climate occurrence in any
locality is publicized as proving impending disaster. However,
climate history contains many past extremes here and there.
For example, the warmest night in Paris was on June 27, 1772
(27.5ºC).
15
Normal or cool temperatures are not news. However,
as stated in my first question, temperatures today on average
are slightly warmer.
Hotter temperatures, of course, do have negative effects. For
example, the northern hemisphere fire season is longer now,
(though many years of fire suppression are the main reason for
mega-fires.
16
) The sea is now slowly becoming more acidic
17
and, based upon satellite data, rising at 3.9 millimeters (1/6
th
inch) per year compared to 2.5 mm in the 1990s and 1.5mm
earlier in the 20
th
century.
18
There are also some positive effects of climate warming in
northern regions, such as longer and more fertile growing
seasons and less dire winters.
13
https://link.springer.com/article/10.1007/s00338-022-02271-6;
https://www.aims.gov.au/information-centre/news-and-stories/southern-reefs-recover-
bleaching?utm_source=miragenews&utm_medium=miragenews&utm_campaign=news;
https://www.washington.edu/news/2020/12/18/coral-recovery-during-a-prolonged-heatwave-
offers-new-hope/#:~:text=Warmer waters can trigger a source within a few weeks.
14
https://nsidc.org/data
15
https://en.wikipedia.org/wiki/Climate_of_Paris
16
https://theconversation.com/how-years-of-fighting-every-wildfire-helped-fuel-the-western-
megafires-of-today-163165
17
https://en.wikipedia.org/wiki/Ocean_acidification
18
https://earthobservatory.nasa.gov/images/150192/tracking-30-years-of-sea-level-
rise#:~:text=Global%20mean%20sea%20level%20has,(0.15%20inches)%20per%20year.

10
My sixth question: How large are the recent fluctuations in
worldwide temperature?
This is a question where I already had the answer when I started
writing. It was a look at actual temperature changes that
motivated my climate questioning.
When a year was the first, forth, or fifth, warmest, it was widely
publicized as an augury of doom, but do you know, for example,
that temperatures in 2022, worldwide and even in the northern
hemisphere, were less than they were in the year 1998? Do you
know that the annual changes in the earth’s average
temperature are much larger than the total temperature
increase since 1850?
Below is the satellite-derived chart from April 2023 of actual
worldwide temperatures, presented as anomalies (changes from
a reference period)
19
.
Yearly Temperature Change Data:
19
There are practical reasons that temperature changes are presented as anomalies rather than in
absolute terms. Calculating the changes from actual temperatures would be very difficult
because each weather station has a different calibration and different temperatures, but if each
station reports the anomalies, their data is presumably consistent.

11
We see above that global temperatures vary monthly from their
averages— sometimes by 0.4 degrees C, and that there are
wide swings over year-long and multi-year periods. What is
causing the very long-term trend will be discussed in my
following questions.
Some of the fluctuations that you see may be explained by the
contrary influences of El Niño and La Niña, and a very few by
powerful volcanic eruptions, but others are for reasons we can
only guess at. In answering my questions below I speculate on
the role of the oceans.
Global temperature has increased in 44 years at the rate of
0.125ºC per decade, but from 2002 to 2022, or over the period
from 1920 to 2022 the temperature only increased 0.1ºC per
decade. If these rates were to continue, it would take 100 years
for worldwide temperatures to increase another one degree C.
12
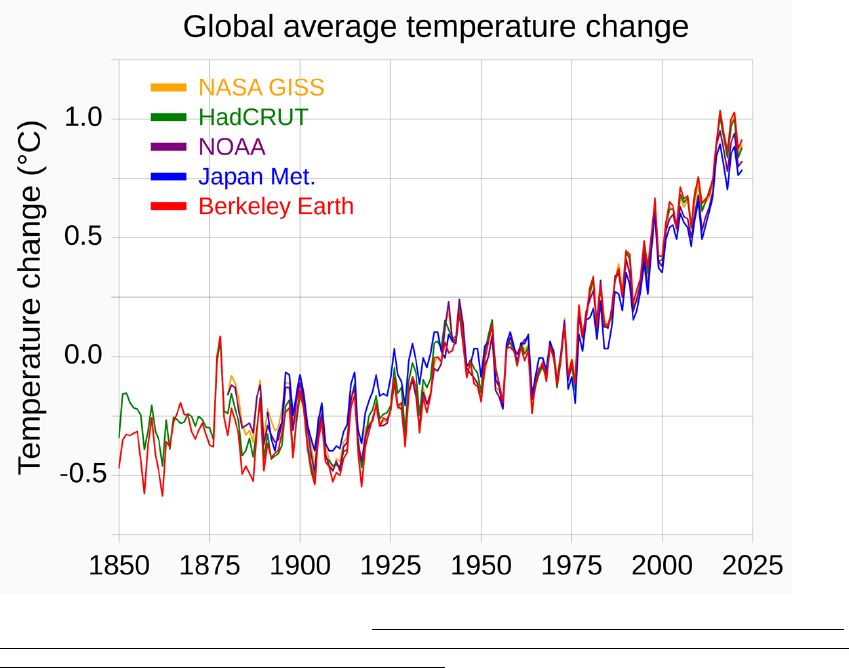
Sources for the charts above: https://www.drroyspencer.com/latest-global-temperatures/;
https://en.wikipedia.org/wiki/Global_temperature_record#/media/File:20200324_Global_average_tempera
ture_-_NASA-GISS_HadCrut_NOAA_Japan_BerkeleyE.svg
The graphic directly above, from 1850 through 2022, shows
more warming from 1980 to 2023 than does the satellite-based
chart — 0.7ºC versus 0.6ºC. As discussed in my Second
Question, this is probably an exaggeration due to the urban heat
island locations of the land thermometers. This graph reinforced
my climate questioning. CO2 rose very little between 1920 and
1940 but temperatures rose, while CO2 rose more quickly
between 1940 and 1980, but temperature declined. I take up
this matter in the question on aerosols (particulates), and I
discuss the nil correlation of temperature with CO2 s in My
eighteenth question on CO2.
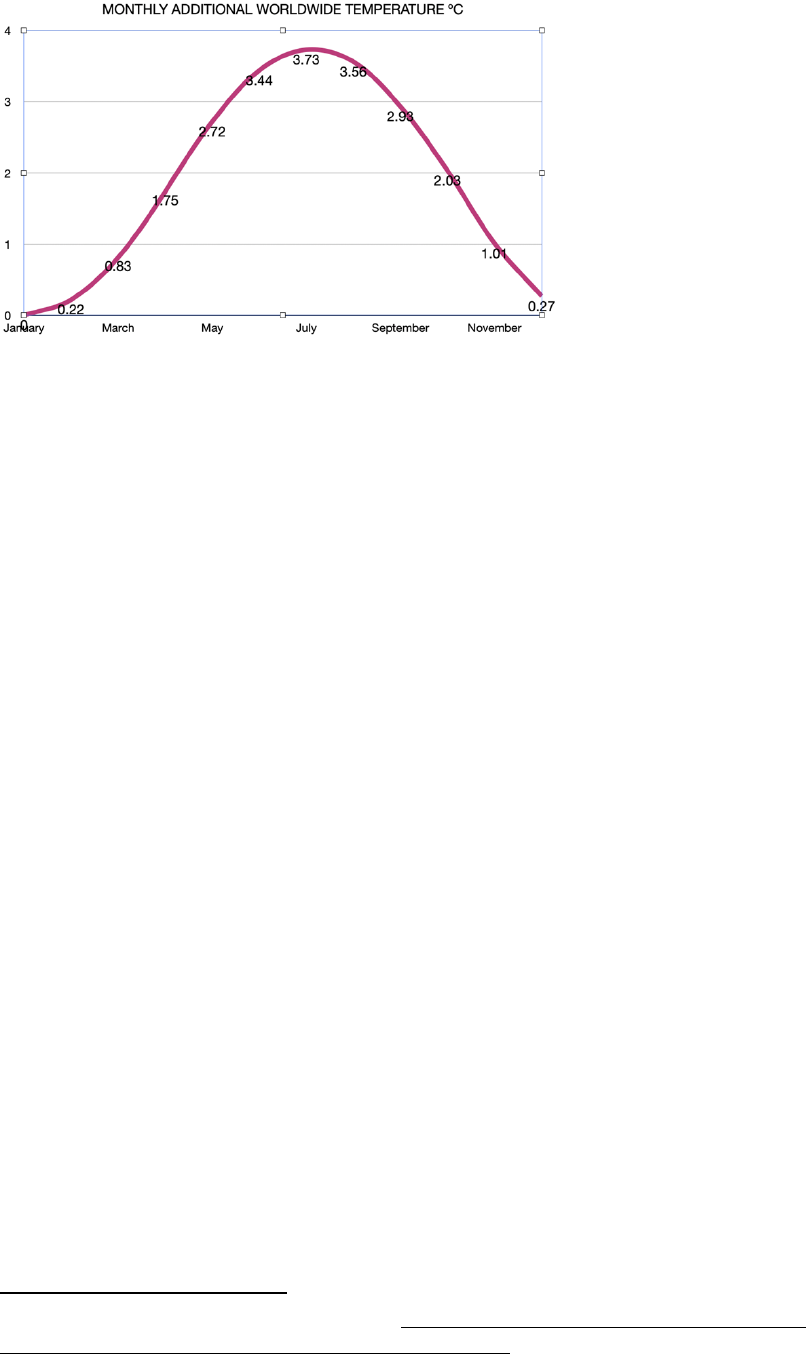
Global Temperature Change by Month
13
Source for above graphic data: Berkley Earth.
Above we see that in an average year worldwide global
temperature varies in tune with the seasons in the northern
hemisphere, where there is 35% more land.
20
My seventh question: Are solar fluctuations warming the
climate?
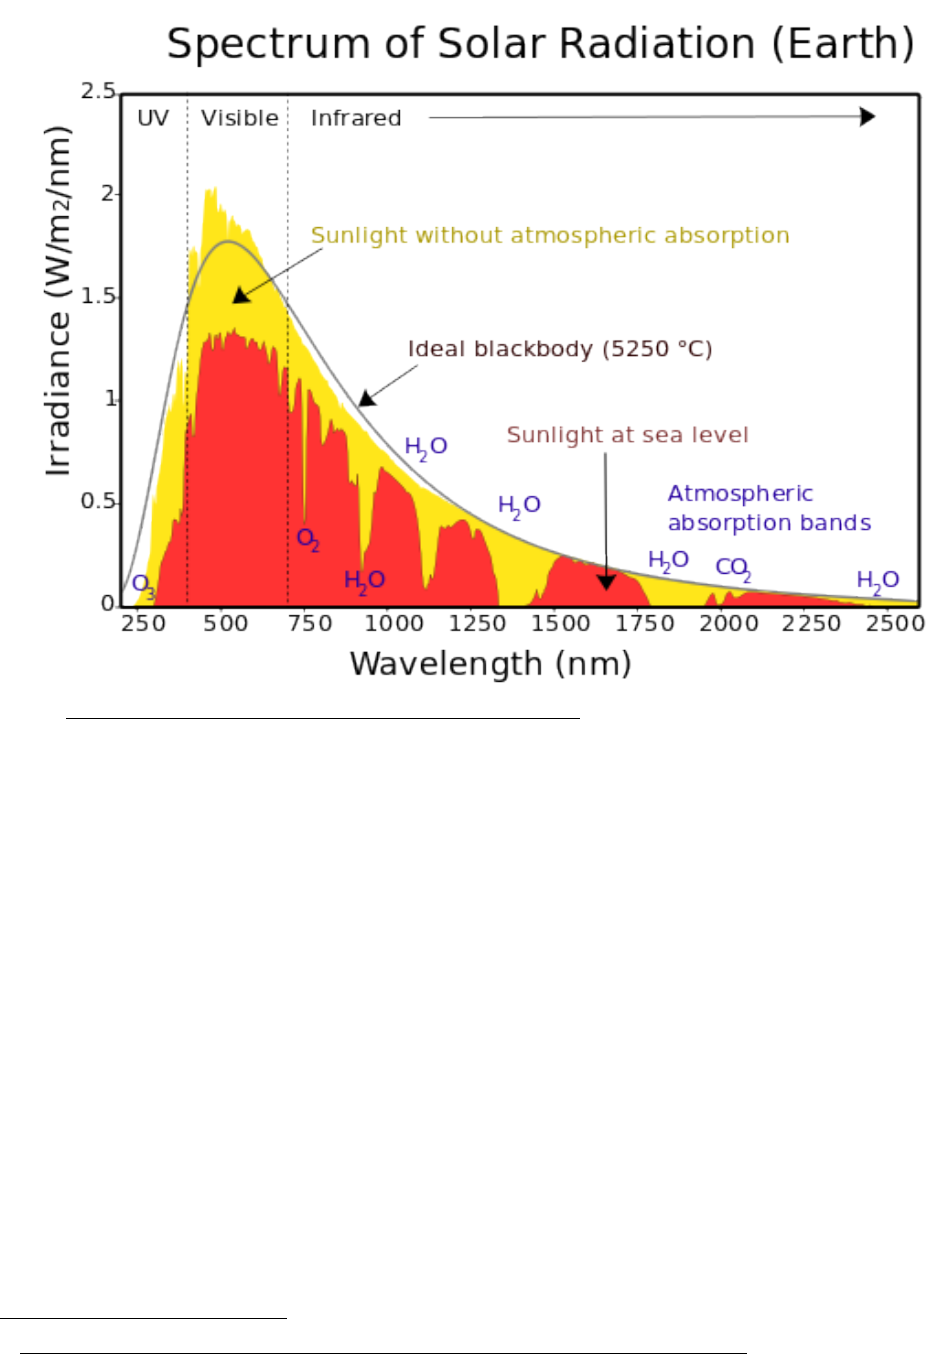
Approximately 1360 watts per square meter of irradiance arrive
at the earth from the sun. Averaging over the earth’s spherical
surface (dayside, nightside, poles), this irradiance is 340 watts
per square meter, and of this only 200 watts per square
meter makes it through the atmosphere and heats the surface
of the earth.
20
This chart is calculated from the data here: https://berkeley-earth-temperature.s3.us-west-
1.amazonaws.com/Global/Land_and_Ocean_complete.txt
14
Source: https://commons.wikimedia.org/wiki/File:Solar_spectrum_en.svg
The sun’s irradiance typically becomes stronger as the number
of sunspots increase and diminishes as the number declines.
Sunspots usually occur in an 11-year cycle, but there have been
long periods when the sun has been warmer or colder than
normal. When irradiance decreases, not only is the earth’s
temperature directly reduced, but also more galactic cosmic
rays enter the atmosphere. This increases cloudiness, which
then reflects more of the sun’s radiation back to space.
However, this effect is minor.
Studies disagree on how much the sun’s irradiance has varied
over history; they range from 3 to 7 watts per square meter
21
—
roughly a 0.2% to 0.5% change. If solar radiation diminished
for a long period by 0.26% — 3.6 watts per square meter, the
earth’s temperature would fall by approximately 3/4ths
ºC and vice-versa. Hence, past changes in climate, such as in
21
https://www.aanda.org/articles/aa/full_html/2018/07/aa31199-17/aa31199-17.html

15
the Little Ice Age and the Minoan Warm Period, may be
explained by solar changes.
In the three most recent decades satellite measurements
indicate that irradiance changes have been minimal and have
not departed from norms, causing at most a temperature
change of 0.01ºC.
22
.
Therefore, the sun is not responsible for recent climate
warming.
My eighth question: Is the heat that comes up through the
crust of the earth (not considering plumes and volcanos)
affecting the climate?
This was an easy question to answer. No. The 0.04 to 0.1
Watt per square meter flow of heat through the earth crust from
primordial energy and from radioactivity are insignificant
compared to the sun’s average radiation of 200 watts per
square meter.
My ninth question: Are Land Volcanos affecting the
temperature?
There is widespread agreement that to affect worldwide climate,
volcanos need to have a VEI (Volcanic Explosion Index) of 5 or
more among other characteristics. (Each additional point in the
VEI equals 10 times more power.) The rare eruptions of this
magnitude put up a veil of particulates and gases that blocks
the sun and decreases worldwide temperatures. If the eruption
is super large and long-lasting, oceans will cool, and thus a
reduced worldwide temperature can persist for years. The VEI 7
eruptions, of Mount Samalas in the year 1257, of the unknown
volcano of 1452, and of Mount Tambora in 1815, each have
depressed worldwide temperatures for a decade.
23
22
A definitive discussion of irradiance variations may be found here: https://ww.swsc-
journal.org/articles/swsc/full_html/2021/01/swsc200108/swsc200108.html
23
https://en.wikipedia.org/wiki/Volcanic_winter#:~:text=The%20explosion%20
of%20Krakatoa%20(Krakatau,Record%20snowfalls%20were%20recorded%2
0worldwide.

16
A series of major eruptions during the 13th -19th century may
partially explain the 0.4º temperature drop of the Little Ice
Age.
24,25,26,27
in the northern hemisphere.
I couldn’t discern in the temperature record any changes from
the major eruptions of 1902, 1906, or 1912, but Mt. Pinatubo’s
eruption in 1991 (VEI of 6 and having the largest effect in the
stratosphere of the 20th century) is likely responsible for a large
dip in temperature that persisted through1993.
28
Volcanic eruptions can increase the earth’s temperature for a
short time if they inject, immediately or through diffusion, ozone
depleting compounds into the stratosphere. A warming effect
sometimes follows a minor cooling one.
Volcanos, then, have neither raised nor lowered recent
temperatures.
24
https://en.wikipedia.org/wiki/Global_temperature_record#/media/File:2000+_year_global_te
mperature_including_Medieval_Warm_Period_and_Little_Ice_Age_-_Ed_Hawkins.svg
25
https://en.wikipedia.org/wiki/Little_Ice_Age_volcanism#/media/File:The_Relationship_betwe
en_Natural_Factors_and_Percentage_change_of_Temperature.jpg (Greenhouse gases are also
mainly the result of vulcanism from the sulfur dioxide released to the stratosphere.)
26
https://en.wikipedia.org/wiki/Little_Ice_Age_volcanism
27
https://en.wikipedia.org/wiki/List_of_large_volcanic_eruptions
28
https://en.wikipedia.org/wiki/List_of_volcanic_eruptions_1500–1999
17
My tenth question: Are Undersea Volcanos and magna
plumes partly responsible for present climate and climate
change?
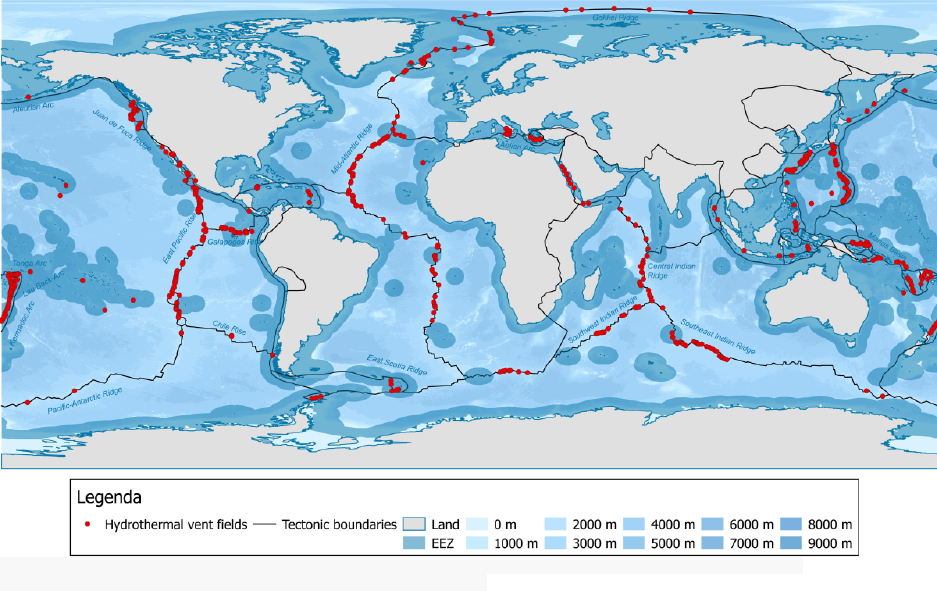
Distribution of hydrothermal vents. This map was created by making use of the [http://vents-data.interridge.org InterRidge
ver.3.3 database. source: https://en.wikipedia.org/wiki/Hydrothermal_vent
We have explored less than 5% of the ocean floor, but it
comprises 70% of the earth’s crust. This means we
presently can only speculate if hot spots or volcanos there
influence climate.
The 3,600 Argo buoy transmitters that have been deployed in
the last two decades to survey the ocean under the surface
provide only a very tiny sampling of 361,000,000 square
kilometers of ocean, and only down to a depth of 2,000
meters. Yet, the average depth of the ocean floor is 3,700
meters and parts are over 10,500 meters (35,000 feet) deep.
Truly, the deep ocean floor is invisible.
Recently satellite measurements of gravity changes have
mapped 20,000 volcanic sea mounts in the shallower oceans,
but nobody knows what percentage of these are active.

18
More than once over the earth’s history, thousands of cubic
kilometers of flood basalts per year have poured out of hot
spots in the earth’s crust. One of these eruptions is
believed to have raised the ocean temperature
worldwide to 38ºC (100F).
29
Mega-plumes of hot water have been observed in shallower
waters,
30
but as mentioned, events in the deeper ocean are
invisible. Basalt and ejected water from mid-ocean ridges
ranges in temperature from 320 to 400ºC, while volcanic lava
is usually well over 1000ºC.
31
The hottest lava issued from
an extremely massive volcano in Hawaii that barely pokes above
the ocean: 2000ºC.
Under the oceans the earth’s crust averages about 5 kilometers
thick, compared to 30 kilometers thick beneath continents,
32
so
it would not be surprising if the deeper ocean floor contained
more active hot spots and volcanos than the continents.
Is it possible for undersea volcanoes to affect world climate?
Certainly a VE8 eruption (the size of Yellowstone) would.
Perhaps an eruption as large as the high estimate for Tambora
would. Otherwise, it seems unlikely as the following calculation
shows.
The largest lava flow on land in the 20th century at Novarupta, Alaska was 15 cubic
kilometers.
33
( The largest on land in recent human history was VE7 Tambora in
1815 with up to 45 cubic kilometers of ejection; the USGS says 100 cubic
kilometers, and for Yellowstone over 1,000 cubic kilometers.)
If a 15 cubic kilometer eruption occurred under the ocean surface at 1,250ºC, how
large a patch of ocean would be warmed 0.1º C? I assume that 80% of the heat
rises in a plume to the top 10 meters of the ocean where it stays (or accumulates)
for a year. We have a temperature reduction factor of 10 x 1,250 =12,500 times
80%, =10,000 times, a volume reduction factor of a kilometer/10 meters, times 15
cubic kilometers =15,00,000 square kilometers warmed 0.1ºC. That is a box 3,000
km x 5000 km — substantial but not enough to affect world climate. The entire
Pacific Ocean occupies 165.3 million square kilometers.
.
29
https://en.wikipedia.org/wiki/Flood_basalt; see that article for its footnotes.
Two examples here: https://www.pmel.noaa.gov/pubs/outstand/bake1050/bake1050.shtml
31
https://tos.org/oceanography/assets/docs/25-1_kelley.pdf, among several other sources.
32
https://pubs.usgs.gov/gip/dynamic/inside.html; https://en.wikipedia.org/wiki/Oceanic_crust
33
https://www.usgs.gov/faqs/what-was-largest-volcanic-eruption-20th-century

19
I have spent many hours looking at satellite-created maps of sea
surfaces temperatures in the Pacific Ocean
34
. The occasional
hotspots that appear in the western Pacific north of New Guinea
are 2ºC above the surrounding much bigger area of hot sea, but
do not persist in the same location from year to year. They
could be due to undersea hot spots and eruptions. We don’t
know, and we presently have no way of knowing.
We also have no way of knowing what has happened in
the deep ocean since the last ice age and before. Are
magna outpourings comparable to those in Oregon
responsible for the unexplained very abrupt end of the
last ice age? Are they responsible for the Egyptian and
Minoan warm periods?
I find the evidence convincing, however, that volcanic activity
under parts of Antarctica and in the Arctic are contributing to
the melting of Antarctic and Arctic ice.
35
The very warm
temperatures in the Arctic have no explanation in current
computer models.
By an entirely different means, and for the first time in recorded
history, the 2021-2022 VEI 6 eruption of the Tonga underwater
volcano has increased worldwide temperature — by injecting a
large plume of water into the stratosphere. Due to rarity, this
type of event cannot be expected to affect future climate
change.
My eleventh question: Are fluctuations in winds and ocean
currents sufficient to affect average global temperatures?
This question has been much studied, but, in my opinion,
still not given enough weight in climate discussions. If
you want to know my conclusions, skip most of the
following exposition.
As discussed in the twelfth question just above, we have very
little knowledge of what is happening under the ocean surface
34
The monthly sea surface temperature maps, for your examination, may be found here:
https://iridl.ldeo.columbia.edu/maproom/Global/Ocean_Temp/Monthly_Temp.html
35
See the evidence for this here:
https://static1.squarespace.com/static/55315cdae4b03d5a7f6f23e1/t/5d9a1b96f4429f27c0da1d9
5/1570380698655/Plate+Climatology+Theory_Detailed+Manuscript.pdf
20
and almost no knowledge of what is happening in the deep
ocean, below 2,000 meters.
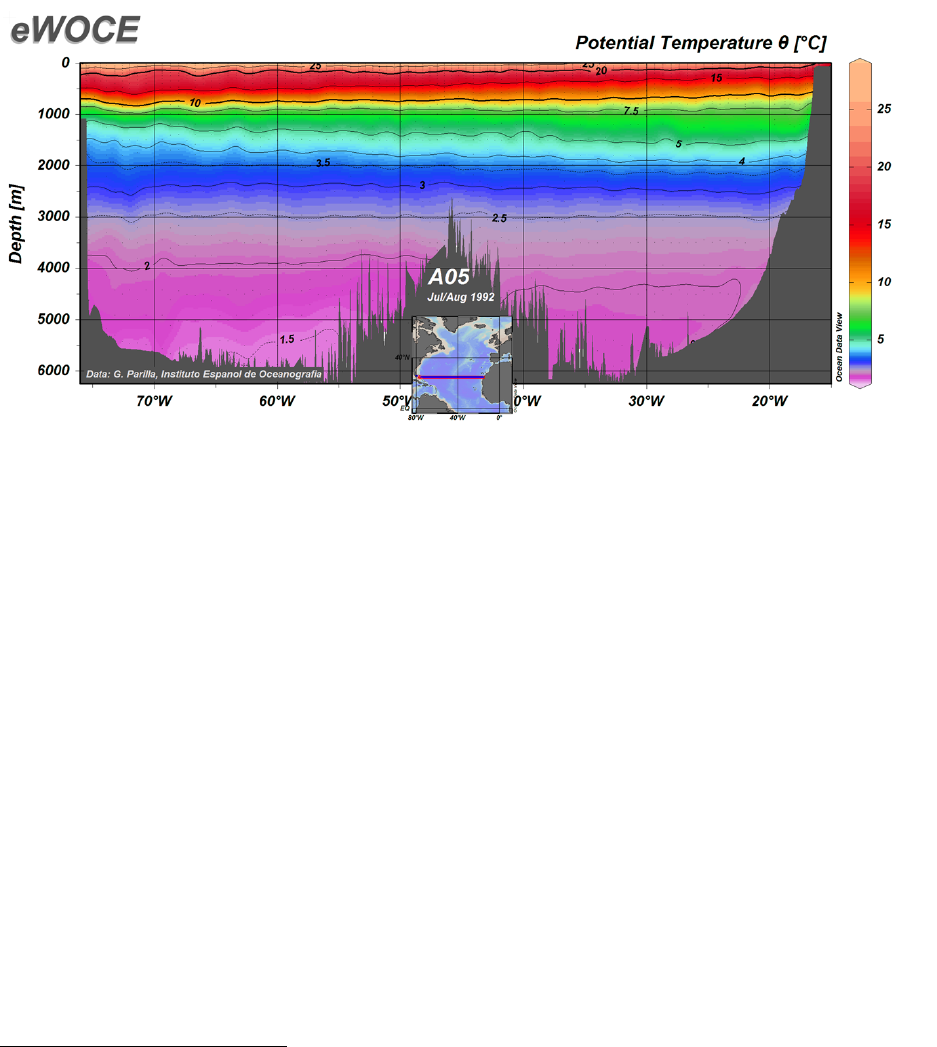
We do know that ocean temperatures are warmest at the
equator, that they decline with depth, especially over 100
meters, and that they are about 2.5ºC at 2,000 meters and even
lower just above the slightly warmer crust). Below is a profile of
estimated Atlantic Ocean temperatures at the equator from the
Spanish Institute of Oceanography:
Note that the very top layer, the mixing layer, is thicker as one
moves west.
Global ocean surface temperatures fall about one-half degree
Celsius between March 15 and November 15, influenced by the
Southern Hemisphere winter where there is more ocean. Ocean
surface temperatures can change rapidly from month to month
and year to year. For example, between March of 2020 and
March of 2021 the satellite measured temperatures of the air
above the oceans worldwide cooled by 0.41ºC (0.31ºC north of
20ºN, 0.61ºC in the tropics, and 0.67ºC south of 20ºS); and
worldwide changed 0.29ºC compared to monthly averages
between January and February of that year.
36
Since the temperature of the surface of land masses is about 9º
Celsius and the average temperature of the ocean surface is
about 20ºC, it is obvious that the under-layers of the ocean have
the potential to cool the climate on land. If the oceans suddenly
36
https://www.nsstc.uah.edu/data/msu/v6.0/tlt/uahncdc_lt_6.0.txt

21
were mixed, they would have an average temperature of about
3º or 4ºC, and the average temperature of the earth would be
well below freezing.
Thus, an increased upwelling of cold ocean waters to the
surface easily could nullify any human caused warming.
Does this happen?
The most famous upwelling
37
is off the coast of South America
and at its strongest it is known as La Niña. It has no name when
the upwelling is average, and when the upwelling is blocked by
warm water it is called El Niño. El Niño takes place when the
westerly trade winds that normally blow sun-heated surface
water away from the South American coast, are weak. Cold
water at the South American coast is denser and therefore
heavier than warm surface water, but when the surface water is
removed, colder water will upwell to replace it or arrive by the
cold northward current along the South American coast from the
Antarctic, where it is replaced by deeper water. The changes
from one state of this system to another is called an oscillation,
and this oscillation — El Niño Southern Oscillation or ENSO —
and all other oscillations are unpredictable — thought to be
caused by chaotic atmospheric changes. (This has not stopped
oceanographers from creating models that predict the swings;
these models fill many pages of the IPCC’s tome.)
The strongest El Niño and La Niña events are correlated with
increases and decreases of worldwide temperatures. Very
strong El Niños are followed the same and next year by 0.1º to
0.2º C increases in worldwide temperatures and very strong La
Niñas by 0.3º C decreases. The average temperature of the
tropical seas where El Niño and La Niña occur are 22-28º C
38
;
while the average temperature of the earth’s land is 8.6º C.
39
The data I have looked at (my calculations) show that land
temperatures increase more than ocean temperatures by very
roughly 2.5 times during and after strong El Niños, and that they
decrease more than ocean temperatures by about 1.8 times
during strong La Niñas.
37
A description of the upwelling processes is here: https://en.wikipedia.org/wiki/Upwelling
38
https://www.cen.uni-hamburg.de/en/icdc/data/ocean/hadisst1.html
39
https://berkeleyearth.org/data/

22
There are many other powerful upwelling oscillations, as
well as large fluctuations in ocean currents, all of which have a
strong effect on regional and world climate
40
. Many of these
occur in areas that have poor historical records and are only
being considered today.
The “reservoir” for El Niño water is the western Pacific. In
normal and La Niña years, the trade wind and the equatorial
current push warm water to the western pacific near Borneo,
where it literally “piles up” and also becomes deeper. The
mixing layer is much thicker in the western Pacific, as was
illustrated in the graphic above; it can vary from 100 to 300
meters in depth. Is this layer partly due to vulcanism? The
western Pacific mixing layer can warm the planet if it
spreads out. I have only seen this discussed very recently, but
it is in fact rather obvious. An animated graphic of sea surface
temperatures from month to month
41
over many years shows
than in warmer years the high temperature layer on the surface
is expanded — north and south, and sometimes west all the way
to the Indian sub-continent, sometimes at the same time as it
has spread east in El Niños.
Temperature readings are taken from the very top skin of the
ocean, and it is this layer that transfers heat to the winds. (The
tropical ocean is warmer, on average, than the air above it.) So,
it is evident that hotter temperatures worldwide can arise from
the mixing layer of the ocean — whether caused by the
movement of water by winds or by the pressure of deep ocean
currents. At the present time, I believe that science does not
have the ability to detail or predict the causes of the spreading.
Variations in upwelling, in ocean currents and surface
spreading, and in winds are plausibly — even surely—
responsible for most year-to-year fluctuations in the
earth’s temperature, and they may also alter the climate
for decades or longer.
40
https://www.whoi.edu/know-your-ocean/ocean-topics/how-the-ocean-works/ocean-
circulation/el-nio-other-oscillations/
41
https://iridl.ldeo.columbia.edu/maproom/Global/Ocean_Temp/Monthly_Temp.html
23
My twelfth question: Has deforestation by humans and fires
caused the climate to warm?
My research on this question has changed my previously held
opinion.
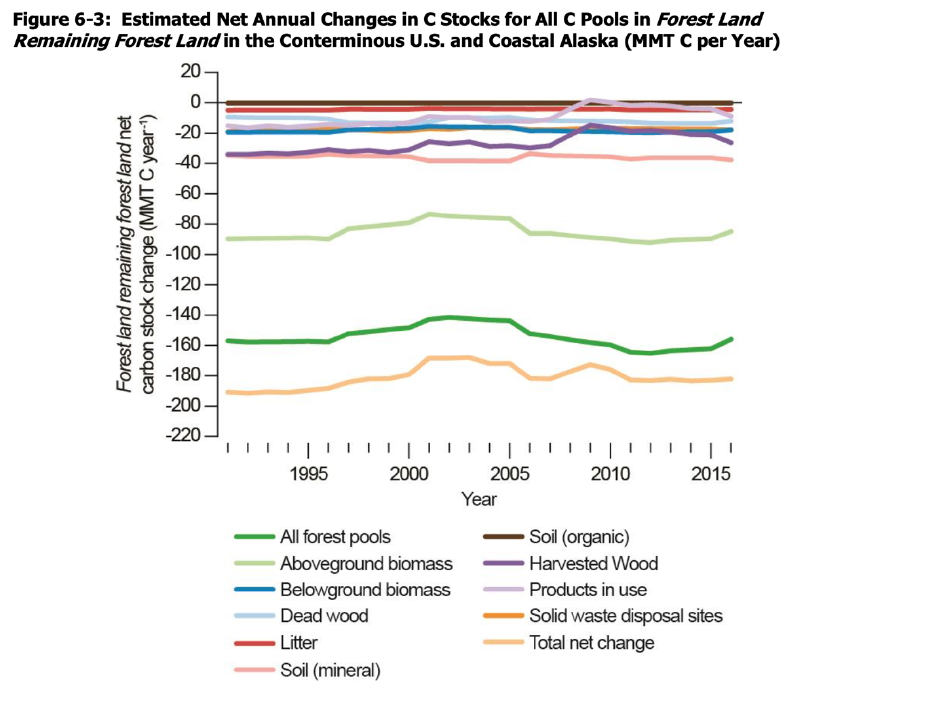
Forest is a CO2 sink, as shown in the following graphic
for forests in the continental USA and costal Alaska:
The category “All Forest Pools” shows the effects within the
forest itself. The biggest contributor to the total is above ground
biomass, and almost all of this is composed of tree growth.
Forest area has increased by about 5% since 1980, mainly
regrowth from previous crop land, so this may account for most
of the tree growth, since eventually trees stop growing. Once
that is the case it is organic and mineral sequestration of carbon
in the soil that is the principal and permanent carbon sink.

24
In snow country, the replacement of northern forests by savanna
or fields almost always has a cooling effect, because
evergreen forests reflect only 5 to 10% of the sun’s radiation
while winter snow exposed by deforestation initially reflects over
80% of it. In non-snow country, cultivated land reflects roughly
11-23%
42
. (Rarely, bare land can be darker than a forest; for
example, when the mangrove forests of the Florida Everglades
gave way to black dirt.
43
)
Most measurements of albedo (how much solar radiation is
reflected) have been completed under clear skies, but a recent
study included clouds. The cooling advantage of open land is
reduced by clouds in temperate zones but enhanced by clouds
in the tropics.
44
The tropics, of course, have the highest
insolation and greatest effect on world temperatures, so it
seems that clouds, overall, multiply the cooling effect of
deforestation.
While cleared land usually cools the planet, the cutting-down or
burning-down of forests to clear land initially injects long-lasting
CO2 into the atmosphere, but this is usually insufficient to
counteract the albedo effect.
The smoke from massive forest fires does not, on bala reduce
warming by blocking the sun, as you will read in uninformed
sources. It increases it because the dark carbon particles in it
absorb solar radiation that might be reflected and thus heat the
atmosphere. The degree of this warming is in dispute and
subject to complex studies and simulations
45
46
If land becomes covered by roads or houses, the additional CO2
released by deforestation may warm more than the albedo
change cools. In wild areas where forest fires are a frequent
42
https://www.worldwidejournals.com/indian-journal-of-applied-research-
(IJAR)/recent_issues_pdf/2015/September/September_2015_1492582725__184.pdf
43
https://today.oregonstate.edu/archives/2011/oct/“albedo-effect”-forest-disturbances-can-
cause-added-warming-bonus-cooling
44
https://www.nature.com/articles/s41467-022-28161-7
45
https://theconversation.com/wildfire-smoke-may-warm-the-earth-for-
longer-than-we-thought-191643
46
https://www.nature.com/articles/s41467-020-20482-9

25
natural occurrence, a California study has found that grasslands
may be a better CO2 sink than forests.
47
48
An important “new frontier” in the tree-climate world is summed
up in this headline from YaleEnvironment360: “Scientists Zero
in on Trees as a Surprisingly Large Source of Methane”.
49
This is
apparently true of all trees, but especially true of trees in
tropical wetlands. Since methane is in the short run a much
more powerful greenhouse gas than carbon dioxide, in my
opinion the long-run degree of climate change reduction benefit
in from forests is unclear.
History provides another way to analyze deforestation. Before
the Middle-Ages the world was relatively warm yet had much
more forest cover. Since the end of the black death and
religious wars, forests have been felled everywhere; and none
the less, until recent industrial times, global temperatures did
not significantly increase.
Unlike what I though before this research, I now
conclude that recent deforestation has not been
responsible for climate warming. The IPCC concurs,
assigning land use changes a small negative forcing in its
modeling.
My thirteenth question: What are the effects of human-
caused aerosol emissions into the air?
This answer is important. Aerosols are liquid or fine solid
particles in the atmosphere. Clouds would fit this definition but
are excluded.
Throughout the 19
th
and 20
th
centuries, the human-produced
aerosol
50
sulfur dioxide (the aerosol with by far the most
powerful temperature effect ) has decreased world
temperatures (and to a minor extent so have carbon particles).
47
https://www.earth.com/news/trees-grass-carbon-sink/
48
A good scientific discussion here, but it seems to ignore what crops might be planted to
replace forests: https://www.ncbi.nlm.nih.gov/pmc/articles/PMC7880589/
49
https://e360.yale.edu/features/scientists-probe-the-surprising-role-of-
trees-in-methane-emissions
50
An aerosol is defined as a suspension of fine solid particles or liquid droplets in air or another
gas.

26
Natural aerosols include sea salt and dust. These substantially
exceed human-caused aerosols, but are not considered to be
increasing significantly, and therefore have been mainly ignored
in climate science. Sulfur dioxide cools by reflecting sunlight
and by seeding clouds that reflect sunlight.
I have found, and will attempt to show below, that the
IPCC has mistreated aerosols, and that proper treatment
reduces the importance they give to carbon dioxide. The
IPCC believes that since 1850 aerosols have cancelled out about
one-half of the effect of CO2 increases, about 0.5ºC.
Aerosols have decreased global temperature since industrial
times,
51
and somewhat in in cities before then, because of
cooking and heating. Between 1940 and 1960 the great
increase in aerosols was partly or fully responsible for a
decrease in world temperatures.
Since 1980, aerosols, both sulfates and carbon particles, have
been decreasing as shown in the chart below. Ironically, this
decrease to improve the environment has been adding to
global warming. From what I have read, at least one
third, and probably one-half of all global warming since
1980 is due to the reduction of pollution. Reductions of
aerosols started with the Clean Air Act in the USA and
comparable acts in Europe, in 1975. It has continued with
improvements in the efficiency of combustion in transportation,
furnaces and boilers, and power generation, the use of low-
sulfur coal, the use of filters and so on. The chart illustrates
these trends.
52
51
https://acp.copernicus.org/articles/22/12221/2022/acp-22-12221-2022.pdf and articles in its
footnotes
52
https://www.pnnl.gov/main/publications/external/technical_reports/PNNL-
14537.pdf
27
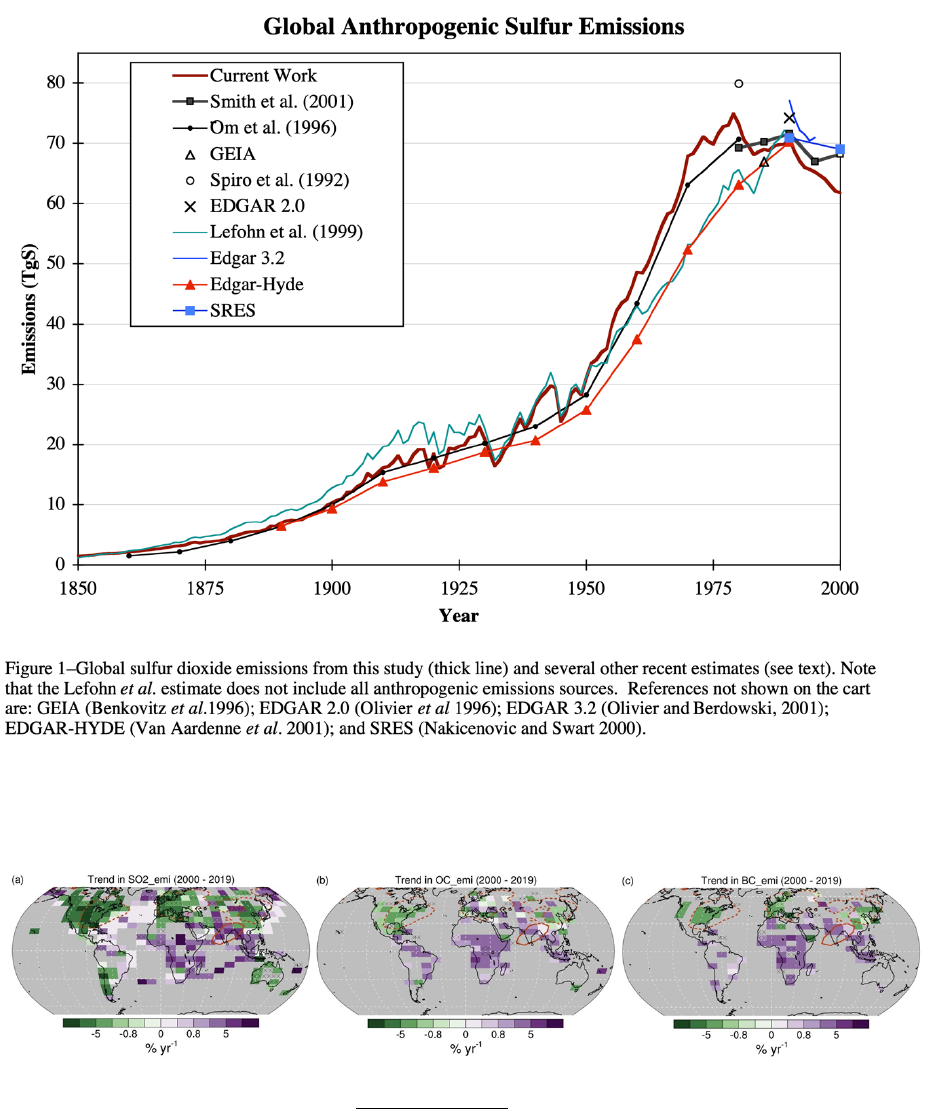
The image shown below from a study for the 2000-2020 period,
shows that aerosols have continued to decline.
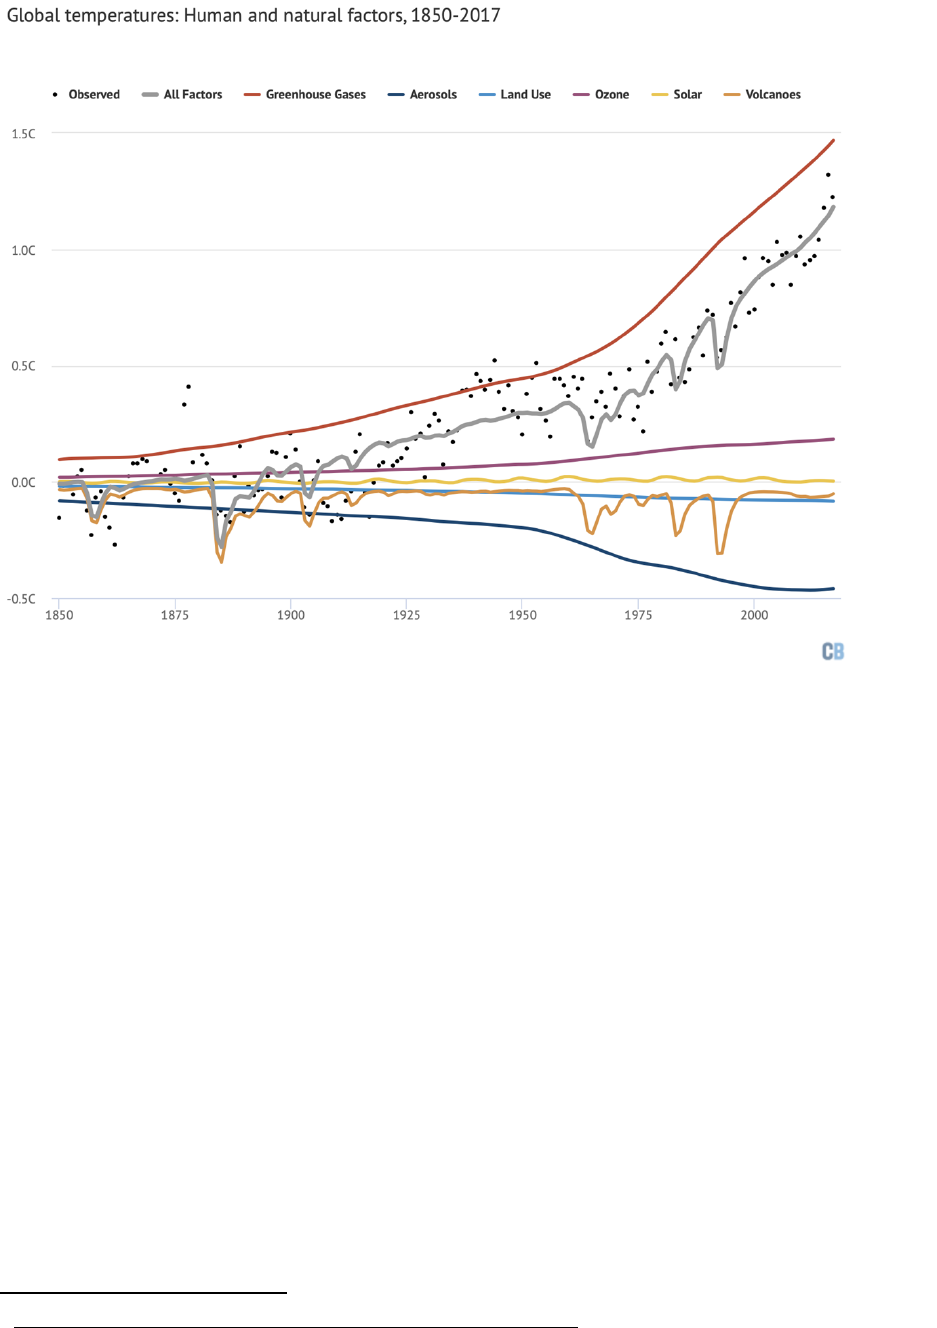
The IPCC, however, has statedt that aerosols continued
to add to cooling since 1980, as depicted in the chart
below!
These images come from the outstanding acp.copernicus.org article referenced above, which was published afer
the most recent IPCC report was written; they show from left to right changes since 2000 in anthropogenic
emissions of sulfur dioxide, organic carbon and black carbon. The changes in Africa and South Asia start on a
much lower base, so have much less effect.
28
Source of above chart: https://cbhighcharts.s3.eu-west-
1.amazonaws.com/100%+Human/berkeley_global_all.html
Because the discrepancy between the reality and the IPCC
seems obvious, I carefully examined the latest IPCC report
based upon scientific work up to 2020-2021,
53
because perhaps
the IPCC had other evidence. Remarkably, all the IPCC text
points to the declines I have mentioned above, but the summary
sentence states that the writers had “high confidence” that
sulfate concentrations were increasing to about 2005. No
opinion was offered for after 2005, and the rate of increase was
unaltered. Even though cited studies found that carbon
particles and sulfates declined in many countries, the IPCC also
decided not to incorporate this in their summary for policy
makers.
In 2020 the International Maritime Organization reduced the
allowed sulfur content of marine fuels by 85%. Subsequent
53
https://report.ipcc.ch/ar6/wg1/IPCC_AR6_WGI_FullReport.pdf 6.3.5.1 and6.3.5.3 pages 845-
6, 847.
29
studies have found that this reduction has caused another 10%
reduction in global SO2.
The IPCC data for the black carbon aerosol is equally suspect.
Unlike SO2, black carbon has a slight warming effect on the
atmosphere but makes surface temperatures cooler by reducing
sunlight. Massive black carbon emissions are IMO the only
reasonable explanation for the gradual dimming of the sunlight
reaching the ground by 20% during the mid to late 20
th
century.
Black carbon did this by absorbing 90% of incoming solar
radiation (and reflecting 10%), cooling the surface but heating
the upper troposphere. That heat was eventually transferred to
the air above the ground. The result was cooler days and
warmer nights, particularly near the summer solstice.
Black carbon emissions, like SO2 have been greatly reduced
since 1980, as is obvious if you are old enough to have visited
New York City, London, Paris, or other large cities in the 1960s -
1980s and walked in the pollution. The result of the reduction is
higher daytime temperatures when the sun shines.
Since most 2020-vintage climate models have been
showing that aerosols since 1980 have cooled the
climate by 0.2C (as depicted in the above chart) when, in
reality, decreasing SO2 has warmed it in 2020 by about
0.2ºC, there is a mis-estimation by total of 0. 4ºC.
Therefore, the warming attributed to greenhouse gases
and other causes in the last 42 years is 0.4ºC too high.
Since the total warming of the period is perhaps 0.4 ºC
to 0.6ºC according to satellites, this is a 66% percent
error. I’ll discuss the implications of this in my
eighteenth question, about CO2.
Fourteenth question: Why and how do greenhouse gases
affect the earth’s temperature?
A person could take an entire college course to understand all
the interrelationships between atmospheric gases. The basics,
however, are not that complicated. I learned early in my
research that to understand greenhouse gases I should
understand the nature of the atmosphere.
30
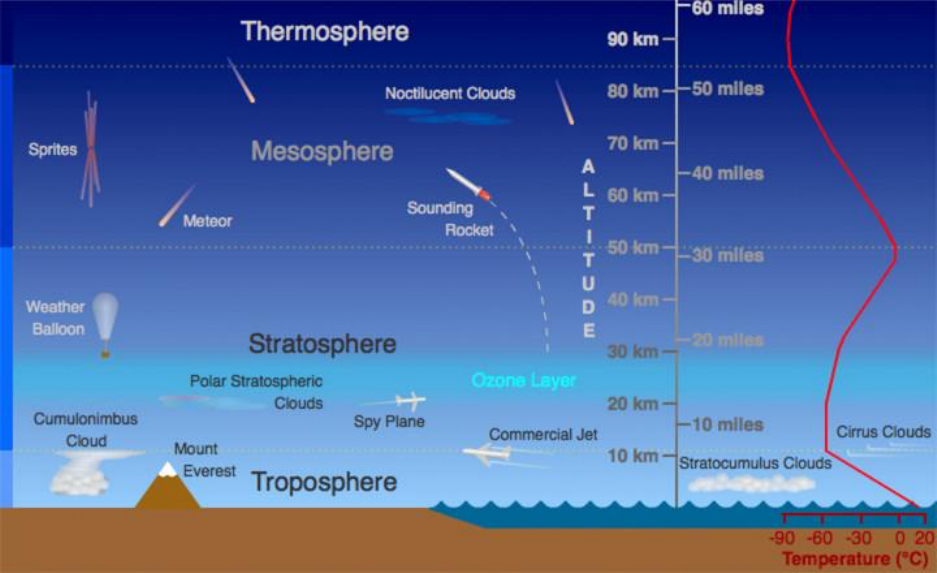
THE ATMOSPHERE
Because air temperatures may fall or rise with increasing
altitude, the atmosphere has well-defined layers.
The troposphere begins at the surface of the earth, where the
average temperature is 15ºC (59ºF). As altitude is gained,
temperature decreases— because the air has less molecules to
vibrate — until the -60º C (-76ºF junction with the stratosphere,
4 km up at the poles, 12 at the equator.
In the troposphere, warm air rises, because hotter air is lighter
than colder air, transmitting heat rapidly by convection. Water
vapor contained in the rising air condenses into clouds and
precipitates, giving off additional heat (the opposite of the heat
it took to evaporate it).
When the stratosphere begins, temperatures rise with
increasing altitude. This temperature inversion stops
transmission of heat by convection. Gases normally only cross
the tropopause by the slow process of diffusion (that distributes
stable gases throughout the atmosphere). Heat, therefore,

31
continues to space from this altitude almost entirely by
radiation.
The temperature is about -15ºC (-5ºF) at the top of the
stratosphere. Why does the stratosphere get hotter with
altitude? It is because the sun’s ultraviolet radiation first
encounters large numbers of oxygen molecules (O2) at the top
of this layer. The UV converts many of these oxygen molecules)
to ozone (O3). Both O2 and O3 absorb the UV, and the process
creates heat. At lower altitudes there is less conversion, so
temperature decreases.
At still higher altitudes, the temperature again begins to drop as
there are now very, very few oxygen and ozone molecules.
54
This region of declining temperature is called the mesosphere.
The mesosphere, and thermosphere above it, have no effect on
climate.
WHAT ARE GREENHOUSE GASES?
Greenhouse gases are those gases whose molecules absorb
outgoing infrared radiation from the earth (and, by some
definitions, incoming radiation from the sun).
This occurs because a greenhouse gas molecule may absorb a
photon of radiation heading toward space; then either re-emit it
in any direction — only occasionally towards space — or convert
the energy to motion (heat).
Thus, the photon is thus usually diverted from continuing to
space, and if it is not, but it encounters another such molecule,
again it will probably be diverted.
The additional molecule is analogous to adding more insulation
to a building. (Note that for a building one must double the
insulation to decrease heat transfer by a comparable amount
and this is also true for the greenhouse gas CO2 that has
already saturated the atmosphere.)
I continually find it astonishing how few of these greenhouse gas
molecules (except for plentiful water vapor molecules) there are
54
Source and further discussion here: https://sciencing.com/earths-atmosphere-composition-
temperature-19463.html https://sciencing.com/earths-atmosphere-composition-temperature-
19463.html
32
in the atmosphere. Their prevalence is measured in molecules
per million or billion molecules of air.
55
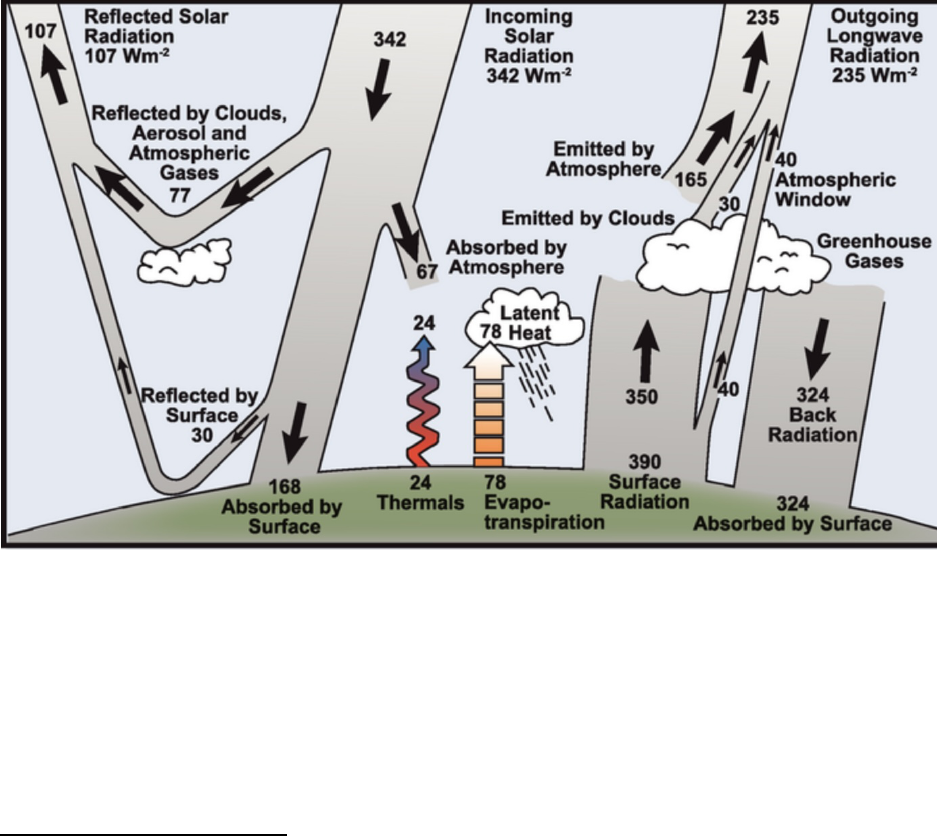
The greenhouse effect is shown in many publications as back
radiation. This is the radiation that doesn’t escape to space
and instead either heats the atmosphere or comes back to the
earth’s surface. Although this radiation adds heat to the earth,
that heat is less than the radiant heat that the earth is emitting,
so you cannot directly feel or measure it. Its net effect is less
cooling of the earth’s surface than would otherwise occur.
The graphic below depicts averages for the entire earth. At any
given time, some parts of the earth will receive much more solar
radiation and/or emit more infrared radiation, for example day
versus night, summer versus winter, the tropics versus the
poles.
Photons have different energies, which are equivalent to
different wavelengths. Each greenhouse gases only absorbs
photons in certain narrow bands of the wavelength spectrum.
Scientists experiment in laboratories to determine precisely the
amount of radiation absorbed by various bands. They use
55
Data for the most important gases is in a chart in My fifteenth question.
33
different temperatures and concentrations of gas. Their results
are used to make computer models of the atmosphere.
There are many unknowns: At any one location and elevation
what is the actual temperature? How much of each greenhouse
gas is at that location and do the absorption bands of one gas
cancel out the effect of the same bands in another? What
processes remove the gas at that location? How long will the gas
last? Do additional units of gas have the same effect as
previous ones?
Satellites have recently helped answer these questions for some
gases, but for other important gases the amounts emitted have
been compiled from frequently inaccurate reports on earth.
Many matters remain imprecise or are calculated by thousands
or millions of lines of computer code. So, in my opinion, the
published numbers for the effect of each gas must be taken with
a grain of salt.
The following graphic roughly indicates how greenhouse gases
cover the spectrum of the sun’s and earth’s radiation.
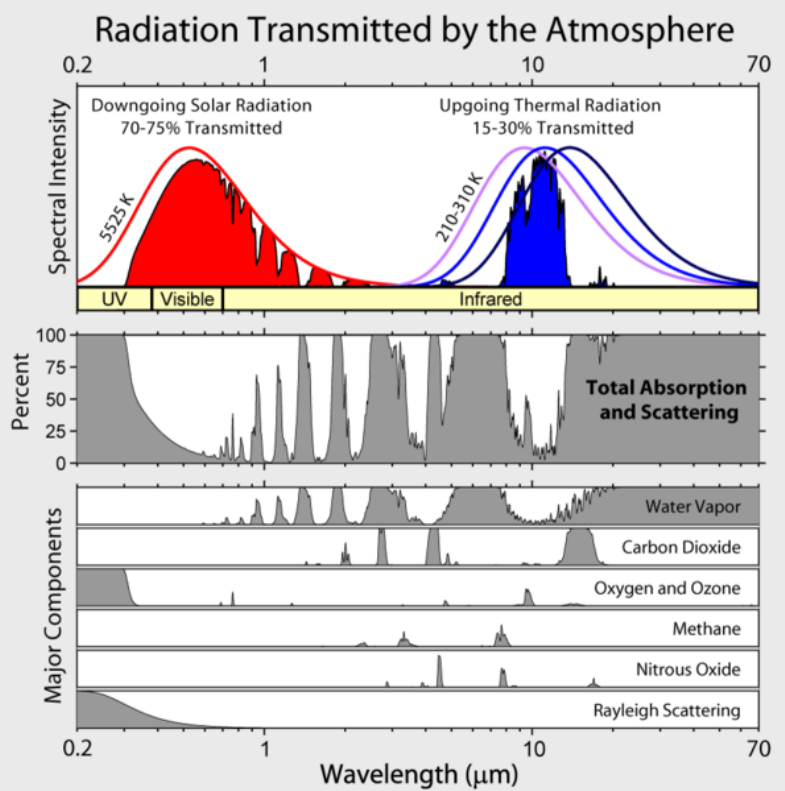
34
The big blue area around 8-15 microns is known as the
atmospheric window because that is where the earth’s
radiation is strongest and yet none of today’s common
greenhouse gases block escaping radiation. However,
unfortunately, many recently-created chlorocarbon and
fluorocarbon gases do — very effectively — and they often have
very long lifetimes. That is why these gasses are the most
powerful forcing gases, and why almost universally steps are
being taken to ban them.
Having answered my question about why and how
greenhouse gases affect global warming, I am ready to
look at the effect of greenhouse gas increases.
35
My fifteenth question: What effect do individual
greenhouse gases have on temperature?
To illustrate this Question, I use “official” IPCC data.
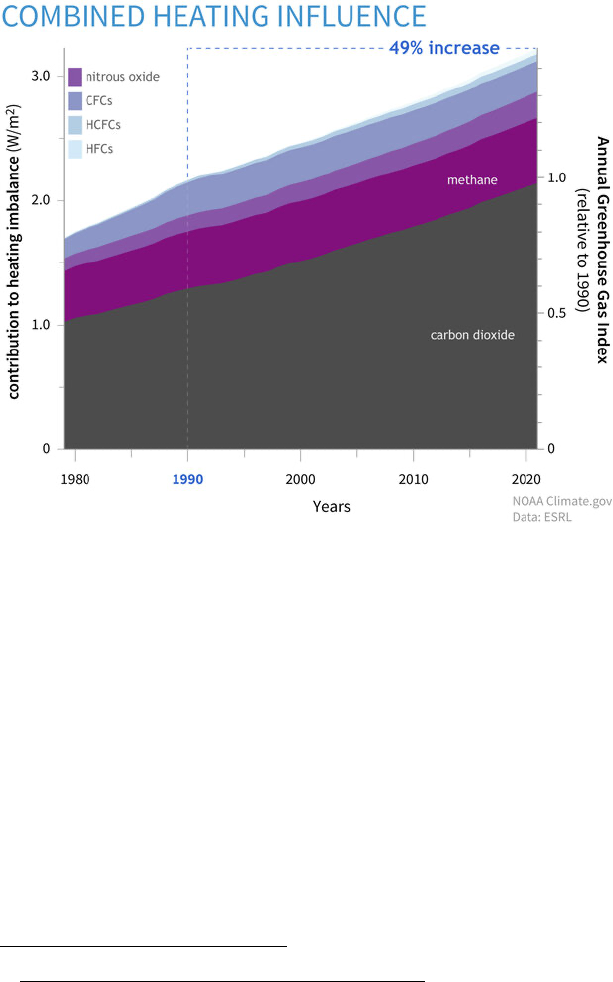
56
Heating Influence is a year-by-year measure of the warming
effect of greenhouse emissions.
57
The Heating Influence shows where we have come from in
emissions and where we are now. But what worries many
people is the future.
Once greenhouse gases are emitted, their quantities decline
geometrically — by (roughly) the same percentage each year –
the amounts remaining become very small, but never
completely disappear. The lifetime of each greenhouse gas is
widely publicized, but never defined. I learned it is not like a
human or animal lifetime; nor is it the number of years when
half the gas is gone (the half-life). Rather it is when the
concentration of gas is 37% (roughly) of its original value. (I
56
https://en.wikipedia.org/wiki/Greenhouse_gas (from IPCC 2021; N2O radiative efficiency
must be somewhat higher for data to make sense.
57
https://www.epa.gov/ghgemissions/overview-greenhouse-gases

36
spent hours digging for a definition, before thankfully finding a
young man’s blog. He took six months to find the answer.
58
)
Global Warming Potential (GWP) is a widely published
number that is the long-term effect of a weight of gas emitted.
Traditionally this is shown compared to CO2. To calculate the
global warming potential of a pulse of gas you add together the
amount of gas that exists in each year of the gas’s total life,
then multiply that by the gas’s absorbing power.
59
Almost all publications use the 100-year Global Warming
Potential. However, to study what has happened in the past 20
years, or what happened between 1980 and 2000, or what will
happen in the next twenty years, we need to use the 20-year
Global Warming Potential.
In
molecule
s parts
per
billion
molecule
s in
atmosph
ere
~2022
Lifetime
(when
about
35% of
the gas
remains.
Immediate
Radiative
Efficiency
in watts
per square
meter
(equal
number of
molecules)
Relative
weight
of a
molecul
e of the
gas
compar
ed to a
molecul
e of CO2
Comparati
ve
Immediate
Radiative
Efficiency
in watts
per square
meter by
equal
weight =
immediate
warming
potential
20 Year
Global
Warming
Potential
(by
weight)
100 Year
Global
Warming
Potential
(by
weight)
CO2
411,000
very
long 100
- 1000
1.37
1
1
1
1
Methane
1893
12
330 - 420
2.74
120 -156
83
30
Nitrous
Oxide
334
114
300
1
300
273
273
Ozone
337
short
300
NA
NA
NA
NA
The IPCC numbers for the immediate radiative efficiency of
methane by weight are the lower of the numbers above. The 20
year and 100 year Greenhouse Warming Potentials are the
IPCC’s. Published statistics of greenhouse gas emissions are by
weight.
58
https://climateer.substack.com/p/methane-lifetime. The number e is the base of natural
logarithms; 1/e = 36.8
59
This laborious calculation can be replaced by the calculus formula for an area under a
geometrically declining curve.
37
I haven’t included the multitude of halogens (chlorine
containing) gases in the chart; they often have extremely high
warming potentials and very long lives; today they have very
low concentrations, and many are banned. It is obvious that if
these are emitted in quantity, we will have run-away global
warming. For that reason, all countries have taken steps to
switch to halogens of lower global warming potentials, and to
limit all halogen emissions. One must hope that rogue
production and use will be eliminated.
Nitrous Oxide (laughing gas) will be especially hard to limit,
because there are many natural sources and because there is
no easy and economical way to reduce nitrogen fertilizer use or
limit its growth in a world short of food. An excellent description
of the problem is found here:
https://www.bbc.com/future/article/20210603-nitrous-oxide-the-
worlds-forgotten-greenhouse-gas.
I will consider ozone (O3), methane (CH4)), and carbon dioxide
(CO2), in separate questions.
My sixteenth Question: How much are fluctuations in
Ozone affecting the climate?
I believed, prior to my research on ozone, that ozone layer
depletion was heating the planet. However, it seems that
depletion of the ozone layer has little effect on temperature
because ozone’s cooling effects are balance by its heating
effects.

38
The ozone layer should not be confused with ground level ozone,
which is about 10% of the total ozone column. Combustion of
fuels and chemical breakdown often produce ground level ozone
— harmful to health, and a significant greenhouse forcer,
about 3/4 as powerful methane.
The formation, distribution, and effect of the ozone
layer:
The ozone layer is mainly formed in the stratosphere by solar UV
radiation when it dissociates oxygen molecules.
The initial impetus to protect the ozone layer of the atmosphere
was to shield plants and animals from UV damage. When the
“ozone hole” was discovered over the Antarctic, almost every
nation banned many uses of long-lasting chlorine and bromine
chemicals that destroy ozone.
The chlorine containing chemicals are stable in the troposphere,
but when they reach the stratosphere, UV slowly breaks them
down. The free chlorine atoms that are produced destroy ozone.
This process is vastly accelerated in the Antarctic by very cold (-
90ºC) polar winter temperatures that create unusual
stratospheric clouds that catalyze chlorine chemical breakdown.
The ozone layer began a recovery, but that recovery has slowed,
even stalled, due to rogue production of banned chlorine-
containing gases and a warmer climate, as well as unknown
causes.
60
61
The latest UN report (2022) says the recovery is on
track to recover in four decades, but going behind the headlines
this is due to a planned continued reduction in chlorine-gas
emissions, and not due to present observations.
62
Twenty percent of the sun irradiance is ultraviolet radiation.
Oxygen, high in the stratosphere, absorbs most of the very
harmful UV-C (of very short wavelength), while most of less
harmless UV-A (near visible light radiation) makes it through the
60
https://acp.copernicus.org/articles/18/1379/2018/
61
https://research.noaa.gov/article/ArtMID/587/ArticleID/2843/Two-additional-regions-of-
Asia-were-sources-of-banned-ozone-destroying-chemicals
62
Ozone: https://www.science.org/content/article/ozone-destroying-chemical-rise-despite-
crackdown#:~:text=It%20is%20already%20being%20replaced,to%202020%2C%20the%20rese
archers%20estimate
39
atmosphere to the surface. The ozone in the ozone layer
absorbs the great majority of the harmful UV-B that is almost
10% of the sun’s irradiant power.
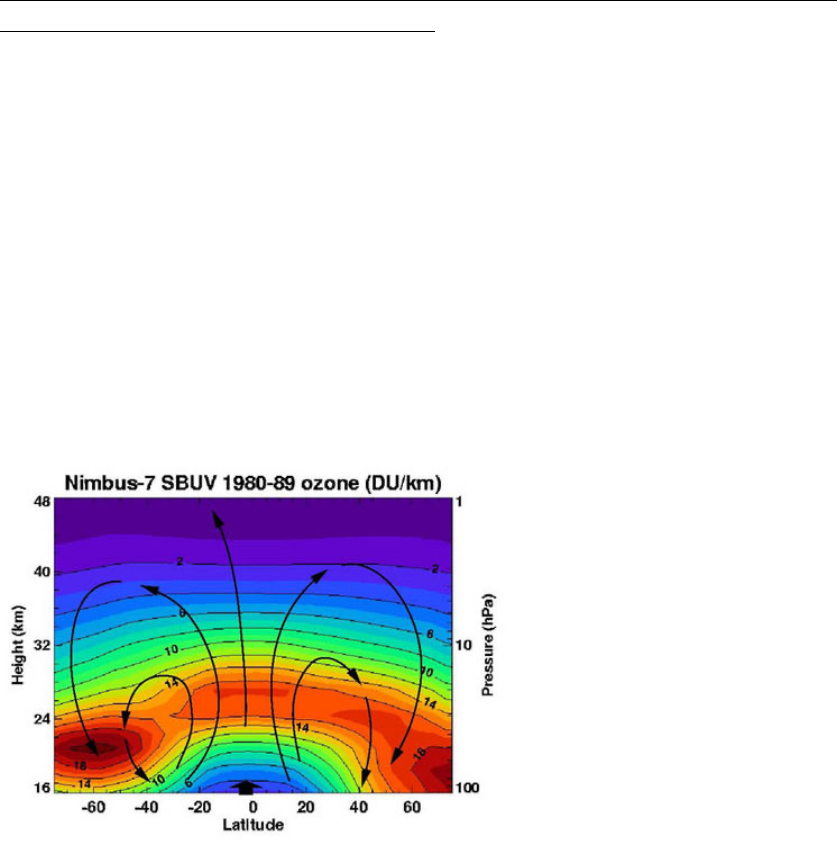
For reasons that will become clear in the later discussion of
methane, it is important to understand that the ozone layer has
always been somewhat thinner in the tropics, even though
ultraviolet radiation is strongest there and the most ozone forms
there. This is due to the so-called Brewer-Dobson circulation
which rapidly moves gases into the stratosphere at the equator,
and then pushes them poleward. These winds have recently
increased by a few percent, presumably because of warmer
temperatures, consequently moving more ozone in the ozone
layer away from the equator. Because more UV radiation now
enters the tropical troposphere, more ozone forms there at
lower levels.
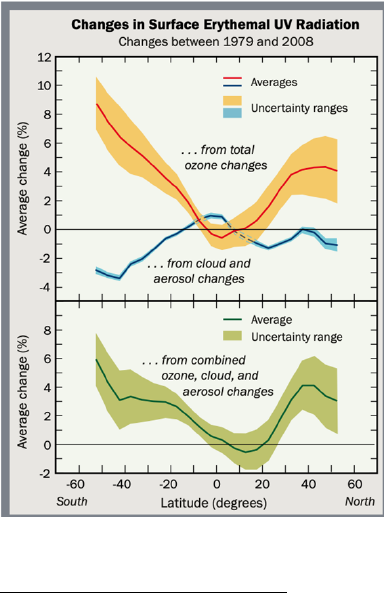
The graphic below shows recent worldwide increases in
ultraviolet radiation at ground level due to depletion of the
ozone layer; this averages, including feedback effects, about 3%
worldwide — about 4% in the latitudes of Europe, Canada, the
northern USA and New Zealand.
(Erythermal means causing sunburn.)
63
63
https://csl.noaa.gov/assessments/ozone/2014/twentyquestions/Q17.pdf

40
Changes in ozone levels have little effect on global
temperature:
Of the solar radiation reaching the earth’s surface, UV is only
3%
64
and of that UV-B radiation makes up only 5%. The sun’s
total irradiance, about 200 watts per square meter.
65
Therefore, an average depletion of the ozone layer of 3% has a
miniscule effect on radiation reaching the earth, about 0.01
watts per square meter.
Countering the warming effect of a thinner ozone layer is the
cooling effect of less of a greenhouse gas of about 0.015 watts
per square meter. Thus, depletion of the ozone layer, neither
significantly heats nor cools the planet.
My seventeenth question: What about future warming from
methane?
This is important. Methane has the second largest influence of
a greenhouse gas, because although there is only a small
amount in the atmosphere, the initial forcing per ton of methane
emitted is perhaps 156 times that of CO2. Its 20-year GWP
(greenhouse warming potential) is around 83 and the 100-year
GWP is about 30. My bottom line of this question is that
methane is a much more important greenhouse gas than is
usually thought, and deserves much more emphasis in
controlling climate warming.
I’ve learned that I disagree with most of what I’ve read
about methane emissions. Data from before 1980 comes
primarily from Antarctic ice cores and or from Greenland. This
data is valuable to show changes from methane concentrations
since the preindustrial era. However, we know now that the
troposphere in the tropics contains a 20% higher methane
concentration than in Antarctica (or likely more), and that
methane rises high in the troposphere and stratosphere so in
my opinion this data cannot be used to calculate the historical
methane worldwide burden. Another problem: in Greenland at
least, results have been found to vary by gas-extraction
64
https://en.wikipedia.org/wiki/Ultraviolet
65
https://www.livescience.com/50326-what-is-ultraviolet-light.html#

41
methods and by the nature of the dust particles that may have
been in the air with the methane.
66
Data after 1980 mainly comes from air sampling stations
67
68
often at locations in the ocean, with poor coverage of the tropics
and interior Asia, and no coverage of the upper troposphere and
lower stratosphere where methane concentrations are high.
The high atmosphere has been sampled by aircraft and
balloons, but with very poor worldwide coverage.
I especially noted the lack of any methane ground sampling
stations in or near India, Pakistan, or Bangladesh or the amazon
(and the lack of satellite data from there as well). I now believe
that much more methane has been emitted there than in the
official numbers, and with a longer lifetime, as explained below.
India contained 285 million ruminants (bovines, sheep and goats) in 1962, 469
million in1992, and 525 million in 2019.
69
This is 50% larger than Brazil for bovines
and three or four times that any of China, the USA or the European Union
70
. India’s
sheep population is second in the world after China.
71
The Indian subcontinent has
the largest goat population. Pakistan and Bangladeshi have approximately another
250 million ruminants.
72
In the Indian subcontinent (and parts of Africa) ruminant dung is used for fuel —
heating and cooking. The stoves there are very inefficient, and the fuel has a high
remaining moisture content and a low carbon content. The result is a high output of
carbon monoxide and other aromatic carbohydrates, which act as drains of OH
radical.
73
74
See the discussion below as to why this probably results in a longer
lifetime for the substantial sources of methane on the Indian Subcontinent. Dung
cooking may have the same effect in other parts of the world, and result in more
methane diffusing into the stratosphere. I do not find this taken into consideration
in the IPCC discussion.
75
66
https://acp.copernicus.org/articles/22/6899/2022/
67
https://gml.noaa.gov/ccgg/trends_ch4/
68
https://agage.mit.edu/global-network
69
https://www.nddb.coop/information/stats/pop
70
https://beef2live.com/story-world-cattle-inventory-ranking-countries-0-106905
71
https://iwto.org/wp-content/uploads/2022/04/IWTO-Market-Information-Sample-Edition-
17.pdf
72
https://en.wikipedia.org/wiki/Animal_husbandry_in_Pakistan#:~:text=As%20of%202020%2C
%20there%20were,30.9%20million%20sheep%20in%20Pakistan.
73
https://acp.copernicus.org/articles/21/2383/2021/acp-21-2383-2021-f09.png
74
https://energypedia.info/wiki/Cooking_with_Dung#:~:text=Burning%20dung%20emits%20far
%20greater,mass%20when%20converted%20into%20biogas.
75
The concentration of stratospheric methane over Africa and India is
confirmed in the graphic here: https://www.caribic-
atmospheric.com/downloads/vanweele_etal_extended_abstract_ncgg6_final_
doc.pdf

42
Scientists have used atomic isotope variations and companion
gases (such as butane) to distinguish between different
methane sources, but the ratios of these gases compared this
way doesn’t agree with the totals measured on the ground.
Scientists have given up explaining the pause in the growth rate
of methane emissions that took place between 2000 and 2007.
76
I had a brief look at the methane/butane ratios for some Chinese
oilfields.
77
The fields that were 15 years older showed one-third
the butane emissions of the newest ones. A study of European
production finds a ration of almost 1 to 7 from old to new
fields.
78
Without a worldwide inventory of these ratios,
calculated data is worthless. So, I reiterate, earlier data on
methane emissions, likely, is substantially too low.
Satellites are just beginning to monitor methane emissions
(2020’s), and they are finding much great emissions than
expected from oil and gas and from landfills. The three greatest
petroleum emitting nations are Turkmenistan, Russia and the
United States. If the leaks declared by the gas industry of 1%
turn out to be nearly 3% or more, which is probable, natural gas
may in fact have nearly as much climate warming potential as
coal.
79
A satellite with high resolution designed specifically to
detect methane emissions launched in 2022. It should make it
easier to limit gas industry methane emissions. It seems,
however, that many of the emissions are from old, diffuse
sources —pipelines and abandoned wells rather than current
drilling.
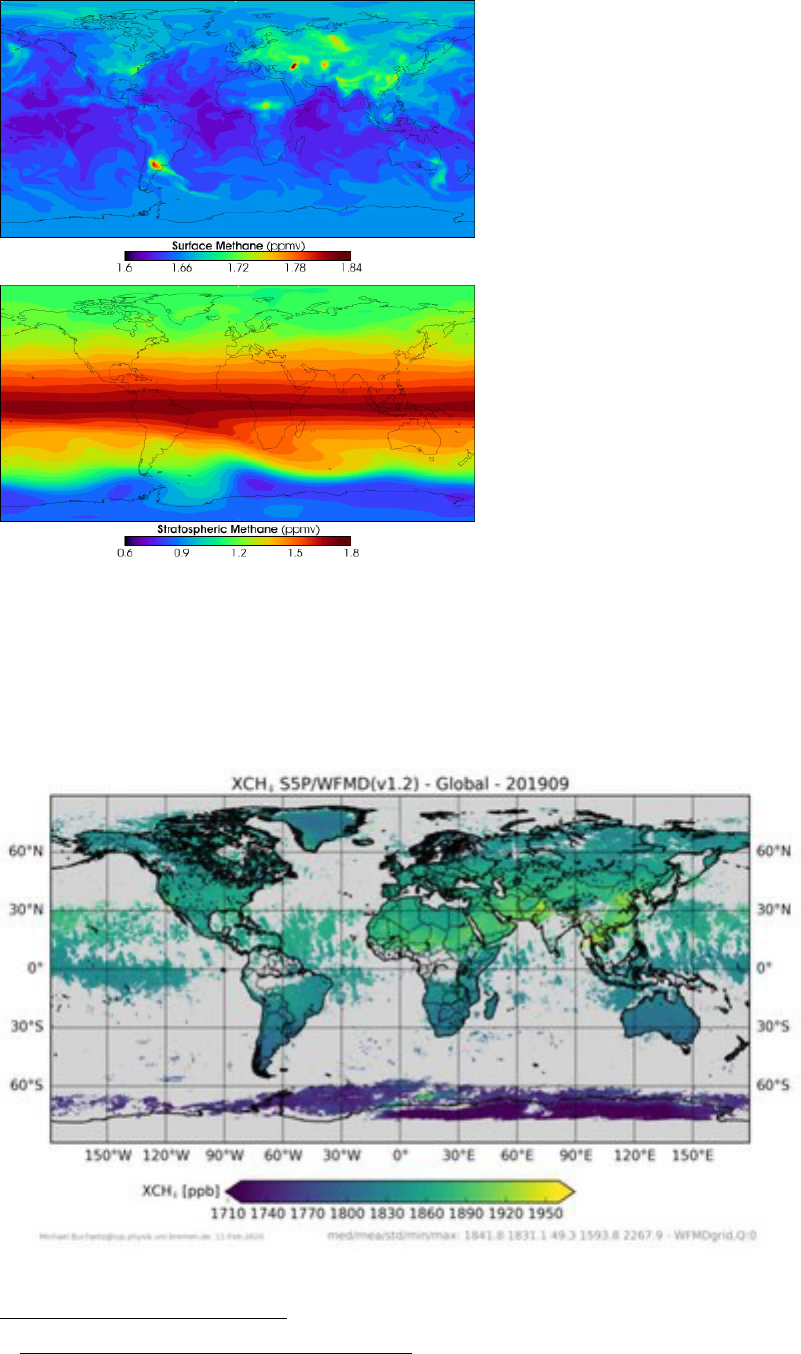
For what it is worth, here is a now outdated graphic from NASA
(2005) of methane distributions at the earth’s surface and in the
stratosphere (in parts per billion by volume):
80
76
https://www.pnas.org/doi/10.1073/pnas.1814297116
77
https://www.researchgate.net/figure/Cross-plot-of-d-13-C-methane-d-13-C-ethane-versus-d-
13-C-ethane-d-13-C-propane-showing_fig8_329410219
78
https://acp.copernicus.org/articles/21/2383/2021/acp-21-2383-2021-f09.png
79
https://www.space.com/satellites-discover-huge-undeclared-methane-emissions
80
See comparable graphics also here: https://www.caribic-
atmospheric.com/downloads/vanweele_etal_extended_abstract_ncgg6_final_
doc.pdf
43
Comparison of the troposphere and stratosphere graphics above
shows that in the tropics stratospheric methane is 12% higher,
while in the mid-latitudes it is 25% lower.
Here is a more recent (April 2018) depiction of the total
methane column taken by satellite using a retrieval algorithm:
81
81
https://climate.esa.int/en/projects/ghgs/Data/
44
Please note that the first graphic uses parts per million by
volume (i.e., molecules), the second parts per billion. Note that
the satellite cannot read the methane volumes near the
equator, where there is the highest concentration. The two
data sets are in conflict, the first showing about double
the methane of the second.
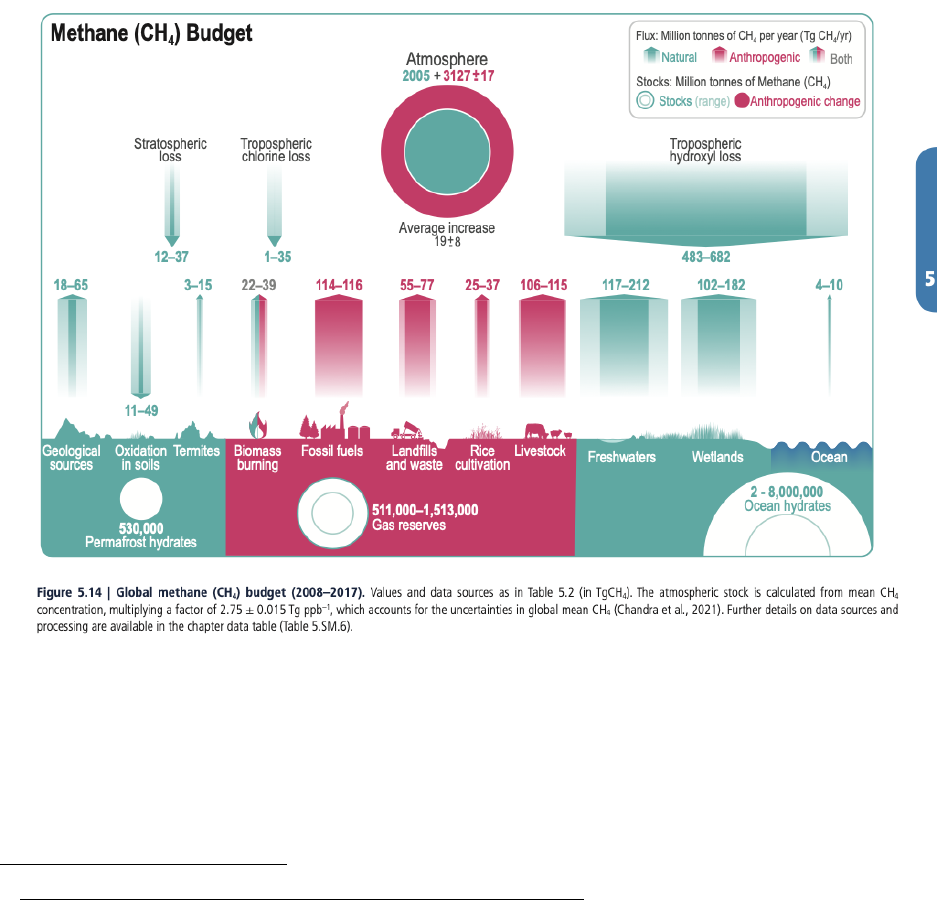
The Methane Budget graphic below is copied from the IPCC
Climate Change 2021 The Physical Science Basis,
82
and is based
upon old data. The accompanying IPCC text points to a conflict
between “top-down” methods of using isotopes and tracer gases
and “bottom up” measures of actual emissions which are higher.
Note that these measurements are by weight. Current data
suggests that the fossil fuels bar of the chart and the wetlands
bar should be much higher.
As shown above, major sources of methane are natural gas,
petroleum and coal, cattle, sheep, goats, termites, bacterial
action in landfills, agricultural waste, wetlands, volcanos,
undersea vents, and forest fires. Not shown is the methane
82
https://report.ipcc.ch/ar6/wg1/IPCC_AR6_WGI_FullReport.pdf Section 5.2.25 page705

45
emitted by forests. Huge amounts of methane are trapped in
polar methane-ice and frozen peat.
Scientists are concerned because the growth rate of
methane is accelerating. The acceleration has been
attributed to various sources, for example increased use of fossil
fuels, more agriculture, more outgassing from wetlands and
polar reservoirs due to higher temperatures, and/or a
diminishing amount of methane sinks per unit of methane
emitted.
Some individuals fear a runaway increase of methane, often
called a “methane bomb”. These increases might occur if
increased methane or carbon monoxide or other hydrocarbons
decrease the amount of OH available to destroy the methane in
the atmosphere, or from the melting of the permafrost, or from
increased temperature’s vastly accelerating emissions from
wetlands. Scientists presently consider these scenarios
unlikely.
83
The major sink (95%) of methane is OH — the very reactive
radical that occurs when H2O (water vapor) loses a hydrogen
atom. OH has been called “the detergent of the atmosphere”.
It destroys most carbon-containing molecules. Due to chemical
reaction times, the OH radical first removes carbon monoxide
(CO) from the atmosphere (40% of reactions), then
miscellaneous organic molecules (often from plants and
pollution) (30%), then methane (15%) and then ozone and
hydrogen-oxygen compounds (15%).
84
Analysis of CO
availability for methane gets complicated rapidly. For instance,
burning in the tropics is a major source of carbon monoxide
85
,
which can vary in amount depending on how wet the vegetation
is.
In my opinion the emissions derived by calculations are
too low while observed methane emissions, which are
much higher, are more accurate but still too low because
of insufficient sampling. The sink that is calculated and
measured CO for methane has not increased, so what happens
to the additional methane? It moves into the stratosphere
83
https://earthobservatory.nasa.gov/images/150967/why-methane-surged-in-2020
84
https://courses.seas.harvard.edu/climate/eli/Courses/EPS281r/Sources/OH-
reactivity/www.atmosphere.mpg.de-oxidation-and-OH-radicals.pdf
85
https://earthobservatory.nasa.gov/global-maps/MOP_CO_M

46
where it is broken down by ozone and OH. Recently the Brewer-
Dobson circulation has been found to drive more tropical air into
the stratosphere than previously calculated or thought, while
the amount of the OH found in the stratosphere is somewhat
higher than in the models.
86
Methane also makes a greater contribution to global
warming than the 100-year GWP of 30 that has been
widely disseminated, due to its breakdown gases. The
IPCC is aware of this but does not publicize the effects of
methane’s breakdown products. When methane reacts with OH
a chemical chain reaction usually leads to 1 molecule of carbon
dioxide (CO2) molecule and 2 molecules of water (H2O). The
CO2 molecule will increase methane’s 100 year GWP by about
2.5%.
The two H2O molecules created will not affect the troposphere,
since atmospheric temperature controls the troposphere’s
humidity, but they will affect the stratosphere. Methane
entering the stratosphere is responsible for one-half of the water
vapor there.
87
This is hugely important, as increases in
stratospheric water vapor have large greenhouse effects and
also deplete the ozone layer. Conversely, according to one
article in Science
88
a one-year decrease of 10% in stratospheric
water vapor decreased climate warming that year by 25%.
To repeat, then my bottom line is that methane makes
and has made a much bigger contribution to global
warming than it is credited for. More has been and is
emitted, and its warming effect is greater than has been
estimated. Therefore, CO2 has made less of a
contribution. If methane’s contribution is increased by
40%, then CO2’s calculated contribution is decreased by
more than 10%.
86
https://acp.copernicus.org/articles/18/4463/2018/
87
https://www.science.org/doi/10.1126/science.1227004
88
https://www.science.org/doi/10.1126/science.1182488
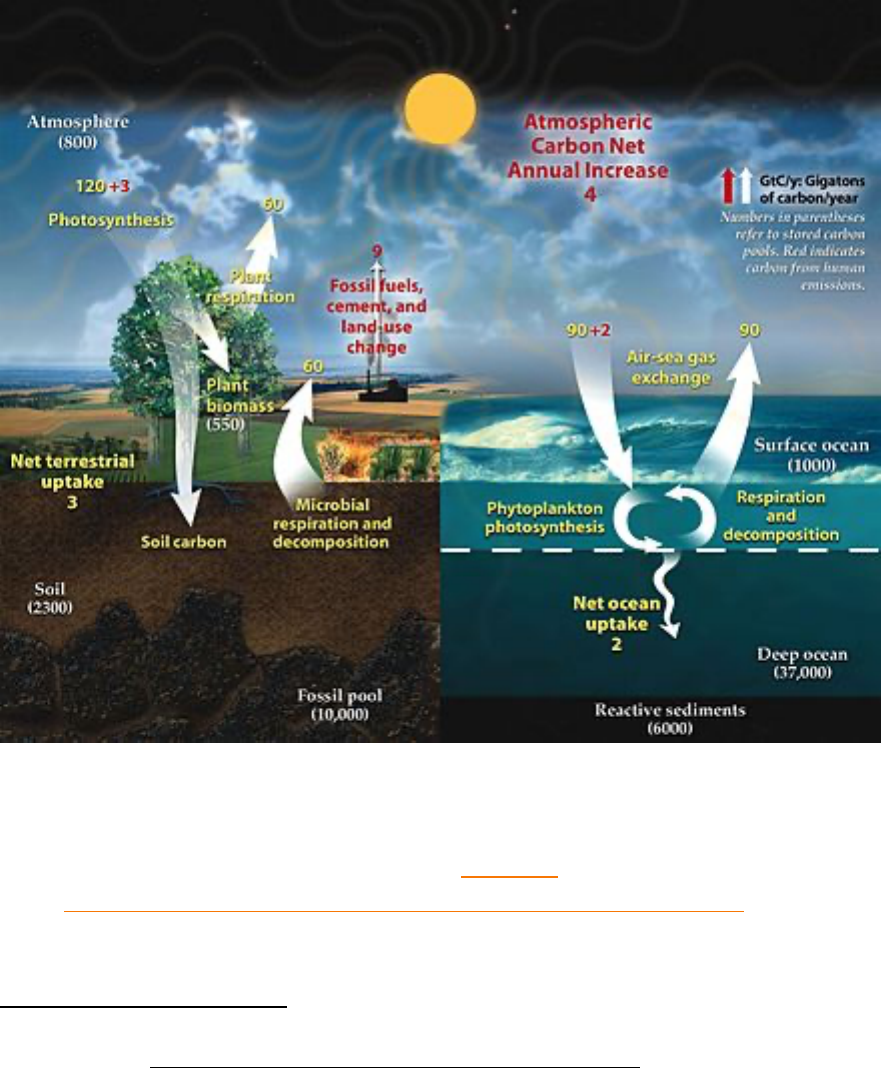
47
My eighteenth question: What has been the warming effect
of carbon dioxide (CO2)?
You can read endlessly about carbon dioxide sources, sinks and
interrelationships in the IPCCs Science report, Chapter 5,
89
but
here I am concerned only with total emissions. The following
graphic gives an overview of the “fast carbon cycle”:
90
(The slow
carbon cycle takes millions of years.)
This diagram of the fast carbon cycle shows the movement of carbon
between land, atmosphere, and oceans. Yellow numbers are natural
fluxes, and red are human contributions in gigatons of carbon per year.
White numbers indicate stored carbon. (Diagram adapted from U.S.
DOE, Biological and Environmental Research Information System.)
89
https://report.ipcc.ch/ar6/wg1/IPCC_AR6_WGI_FullReport.pdf
90
Graphic from: https://earthobservatory.nasa.gov/features/CarbonCycle

48
Note that the above diagram is representative and probably not
accurate in detail. For instance, phytoplankton are recently
considered to have a bigger role than previously thought.
Plant and microbial fluxes are mainly in balance (because the
earth’s temperature adjusted long ago to create the balance),
while almost one-half of the human contribution in the industrial
age causes a net atmospheric increase of CO2 of about 1/2
percent per year (and the rest is slowly acidifying the ocean).
As far back as 1896 a Swedish scientist calculated that doubling
CO2 levels in the atmosphere would cause world temperatures
to rise 5ºC. But scientists generally believed that other
influences were stronger such as the sun, and that the ocean
was a sufficient sink for CO2 gas. Worldwide temperatures
began rising rapidly after 1980, and measurements at altitude,
(at Mauna Loa, Hawaii, for example) documented rapidly
increasing atmospheric CO2 gas. Absent any other credible
explanation, and also considering the centuries-long life of the
CO2 being added to the atmosphere, most scientists bought into
the CO2 hypothesis
91
, but there are dissenters.
91
For a more detailed account of the history see https://www.lenntech.com/greenhouse-
effect/global-warming-history.htm
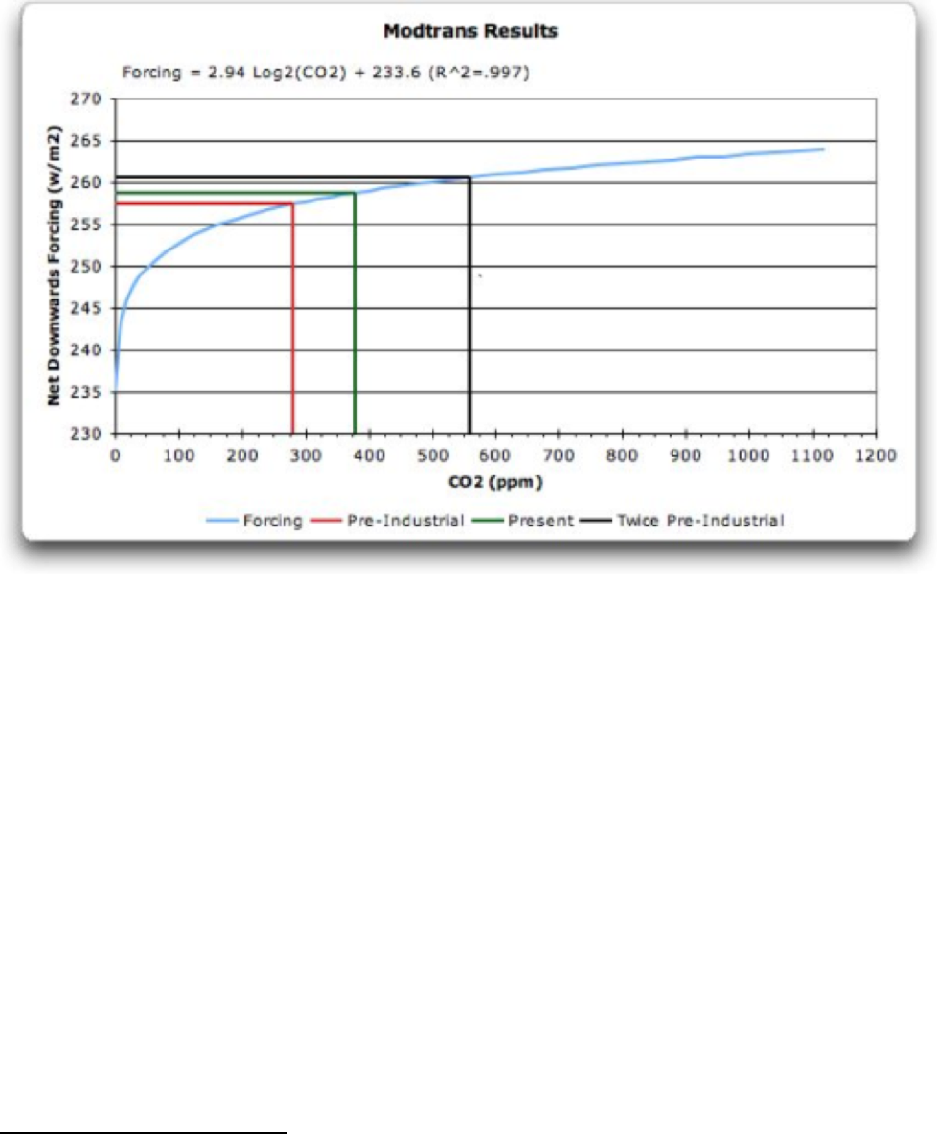
49
How fast has carbon dioxide (CO2) been increasing? When
will it double from the 1850 level?
1850 CO2 levels were 280 parts per million. So, a doubling
would be 560 ppm, as illustrated in the above graph. (Please
note that each additional unit of CO2 adds slightly less forcing.)
Levels are now (January 2023) roughly 419.5 ppm. Thus, we are
140 PPM away from a doubling of pre-industrial CO2 levels.
The Washington Post in 2021 ran an article stating that the
doubling would take place by 2060,
92
— in 37 years. However,
the data for January 2023, as compiled on the big island of
Hawaii, shows an even linear trend in the last four years of 2.25
parts per year.
93
(That’s slightly higher than the graphic of the
carbon cycle.) Assuming that this rate continues, CO will
double from preindustrial times in 2085, 62 years away.
What effect has increasing CO2 had on temperature?
92
https://www.washingtonpost.com/weather/2021/04/05/atmospheric-co2-concentration-record/
93
https://gml.noaa.gov/ccgg/trends/

50
MULTI-DECADE CHANGES IN CO2 AND TEMPERATURE
(ºC)
CO2
LEVEL
IN YEAR
CO2
increase
from
previous
period in
units
CO2 percent
increase in
period
(more valid
measure
since all
agree CO2
effect
declines per
unit)
Temperatur
e Anomaly
TEMPERATUR
E CHANGE ºC
DURING
PERIOD
Temperature
change
adjusted by
me to account
fo influence of
aerosols (see
My thirteenth
question)
1860
280
-0.4
1880
291
-0.3
1900
296
-0.4
1920
303
23
8.2
-0.3
0.1
0.1
1940
310
7
2.3
0.1
0.4
0.4
1960
317
7
2.2
-0.1
-0.2
0.0
1980
339
22
6.9
0.2
0.3
0.3
2000
369
30
8.5
0.5
0.3
0.2
2022
419
50
13.7
0.6
0.1
0.0
TOTALS
131
1.0
1.0
Correlati
on of CO2
percent
change with
temperature
change:
0.10
-.37
From the second to last column of this chart, we see that
the correspondence between CO2 increases and
temperature increases has been very, very weak (a
correlation of .10 — virtually nil).
In the last column, I increase the temperatures for the 1940 to
1960 period and decrease those from 1980 to 2022, to account
for aerosol increases and decreases, but now the correlation
turns negative (that is, when the percent increase of CO2
increases temperature change decreases).
51
Arguably, all the temperature increase from 2000 to
2022 has been caused by the reductions in aerosols.
The data above is enough to confirm anyone as a “climate
questioner”, as it did for me when I first looked at it. CO2 must
have an effect, but that effect is entirely overwhelmed by
changes in aerosols and in the ocean.
My adjustments to the warming caused by CO2:
I believe the following: A) The instantaneous forcing of every
other gas and aerosol is known with much greater certainty than
for CO2, both because the amount of forcing per molecule is
many times larger and because the other greenhouse gases are
not saturated in the atmosphere or in conflict with water vapor.
In other words, the forcing from CO2 is almost impossible to
measure.
B) If the amount of another gas such as methane must be
increased or if an allowance for undersea magma heating must
be made, or if the amount of aerosol has decreased from the
level posited by the IPCC authorities, then the adjustment must
be balanced by corresponding decreases in CO2 forcing.
C) The amount of CO2 forcing estimated by the IPCC
since 1850 should be reduced by at least 40%.
The chart below from the ICC gives their interpretation of the
human caused historical causes of increasing temperatures.
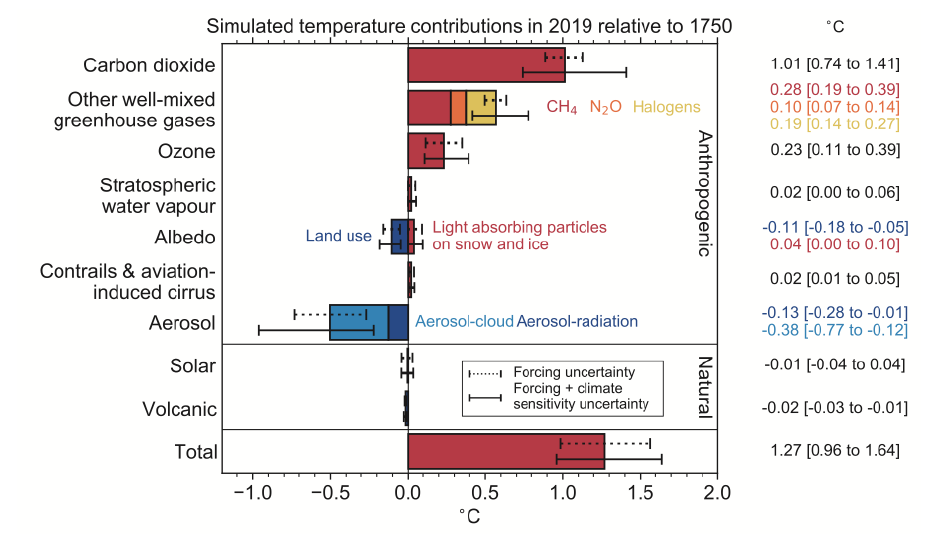
52
Based upon my findings in my questions above, the aerosol bar
(.51), should be cut in half and the other well-mixed greenhouse
gases bar (.57 increased by about a third). These changes
reduce the CO2 bar from 1.01ºC to 0.57ºC.
My nineteenth question: How has the IPCC predicted future
temperatures?
I have spent many hours trying to understand the answer to this
question. I do not think the method of the IPCC, or any similar
method is reliable, as I discuss in detail in My twentieth
question, but since it is the method used in most climate
science, it is worth understanding.
However, even after you understand the method in general —
even if you spend hours and hours studying the IPCC’s
assumptions and doing your own math — the complexity of the
IPCC inputs and their use of computer simulations means that
you must take the IPCC result on faith, as most people do, or
ignore it.
(My twenty-first question provides my own calculation by
an easily understandable method.)
53
To estimate future global warming using the IPCC method, the
first step is to calculate a future forcing from each gas or other
element, measured in Watts per square meter of the earth’s
surface. Next, one adds these forcings together. Third, one
adjusts the result by all the physical feedbacks. Finally, one
multiplies the result by the climate sensitivity to convert the
Watts per square meter to a temperature change. All the
modelers adjust their equations so that the model will
give the present temperature and the estimated change
from 1850 to the present.
Forcing:
Generally, you will not find published data for an
instantaneous forcing, the first day’s impact of an
additional unit of a gas or aerosol, unless you read
scientific journal articles. The IPCC in its two-thousand-page
volume publicizes forcing since the beginning of the
industrial age, or forcing projected over the next 100
years, or forcing until CO2 doubles; and the IPCC expressly
encourages scientists to use temperature changes over these
time frames — to promote its agenda with the public.
Forcing for each element is determined in whole-earth
complicated computer models of present conditions or
sometimes in simple overall models. All scientists agree that
individual forcings can be added together.
Physical Feedbacks
Physical feedbacks are the changes in the climate
system that occur due to forcings.
Water vapor is the biggest positive physical feedback. Water
vapor is not only a very powerful greenhouse gas with a wide
absorption spectrum of the earth’s radiation, but also is also
widely distributed throughout the atmosphere — far more so
than other greenhouse gas. Water vapor is mainly responsible
for making our planet’s average temperature tolerable:
approximately 15ºC (59ºF) (depending upon the month), rather
than roughly -13ºC (9ºF).
54
Water vapor is not considered a forcing because we cannot
directly affect the amount of it by our actions. How much water
vapor is in the atmosphere is determined by the temperature of
the air. If forcings causes the air and ocean temperature to rise,
more water vapor will be evaporated.
Other important physical feedbacks are warming-induced
changes in albedo (the amount of sunlight reflected by snow,
for example) and in clouds.
Please note in the following graphic the very important Planck
negative feedback. This is the increase of radiation to space
occurring because of warmer earth temperatures. It causes
the sum of all physical feedbacks to be negative.
The Planck feedback is based upon a general law of physics:
the radiation emitted by a surface increases with the fourth
power of its absolute temperature. This means (subject to small
adjustments) that if the earth were black and its temperature
increased by 1/3% (1ºC), ((276ºK>277ºK), radiation to space
would increase by 1.5%. The actual percentage is very
approximately 1% because the earth is not black.
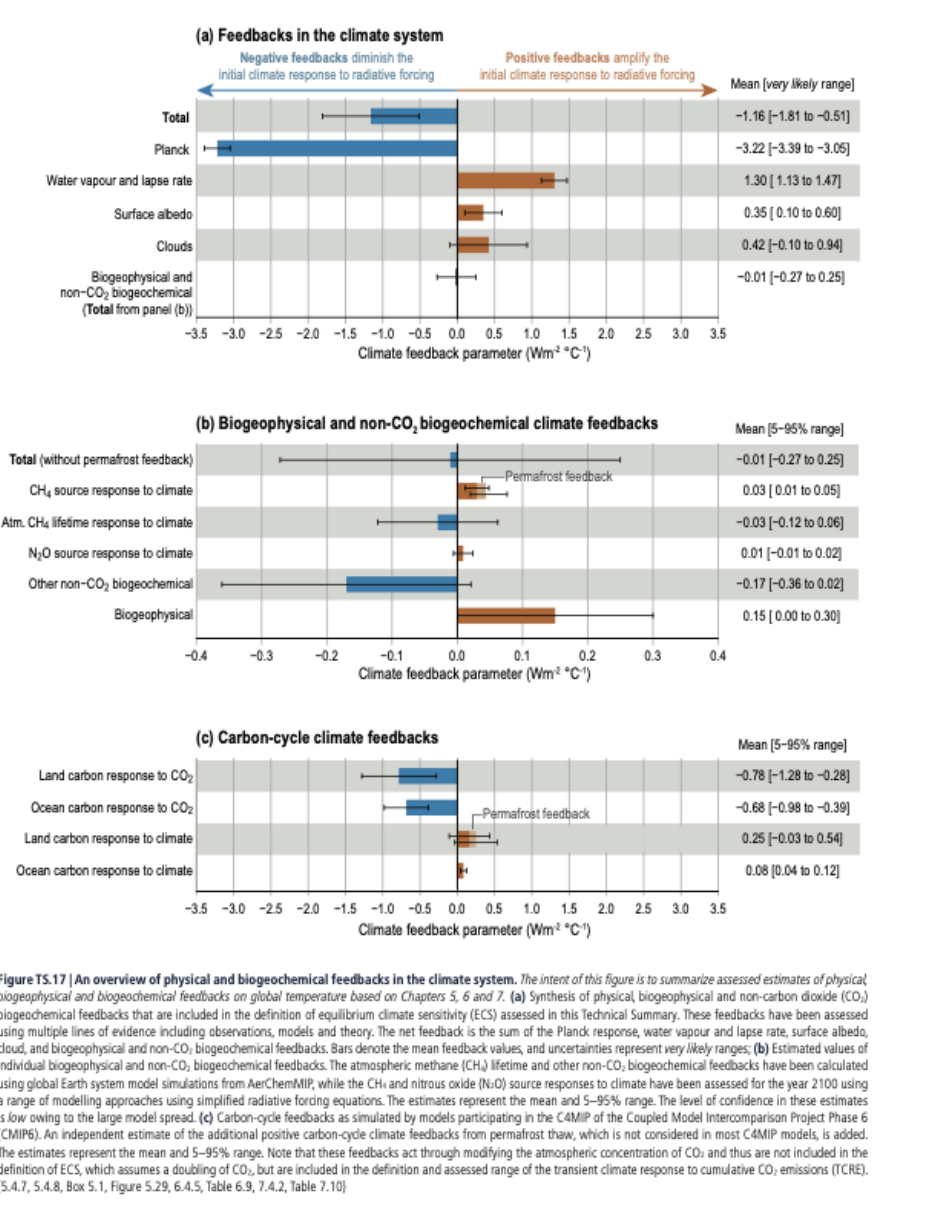
55
.
56
Climate Sensitivity:
Climate sensitivity is the amount you must multiply a
future forcing-feedback total by to arrive at a future
temperature. Climate Sensitivity is calculated using various
definitions, sometimes after full adjustment by the oceans,
which take years to catch up with changes on land, sometimes
the temperature that will exist when CO2 doubles, and
sometimes just the multiplier one must use to convert Watts per
square meter changes to temperature changes. Confusion
often arises — because the definition being used is not made
explicit.
Models estimate climate sensitivity (equilibrium climate
sensitivity, or perhaps effective climate sensitivity) from less
than 2 to more than 7. The IPCC presently likes 3. I am not sure
what “Future projections” means – most likely when CO2
quadruples as this is often calculated.
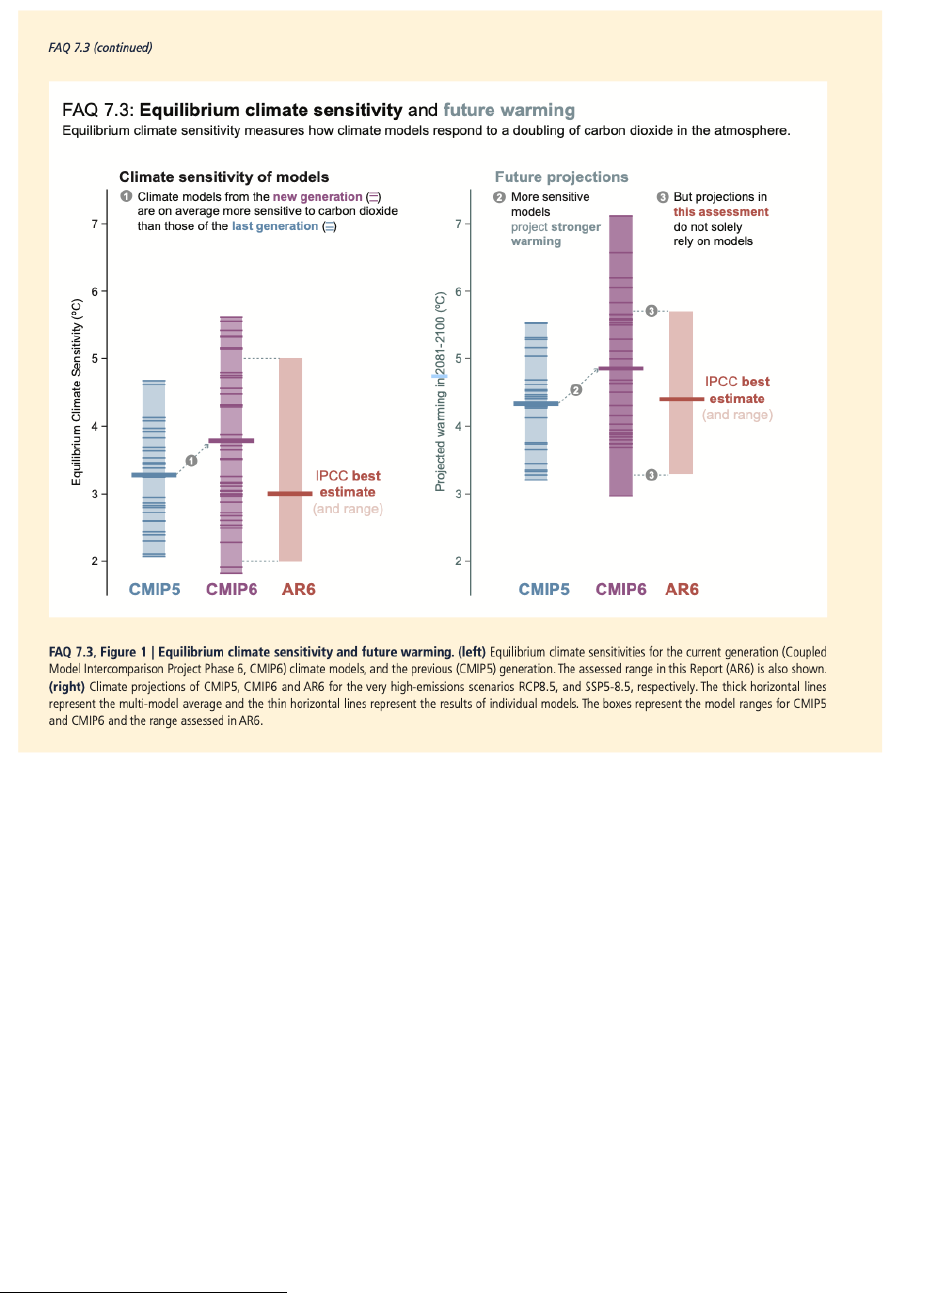
57
Besides current models and their own model, the IPPC considers
complex paleolithic models. These rely on ice cores, boron
isotopes, species, and other proxies to determine temperature
and CO2 concentration changes over periods in the past,
particularly the Cretaceous, which had conditions similar to
those of today. It is easy to be biased in choice of data because
in some thousand-year periods higher CO2 has preceded higher
temperatures, in others have it has followed temperature
changes,
94
and in still others it has been inversely
correlated.
95
94
https://www.nature.com/articles/s41561-020-00680-2
95
https://www.nature.com/articles/s41598-017-08234-0#ref-CR14
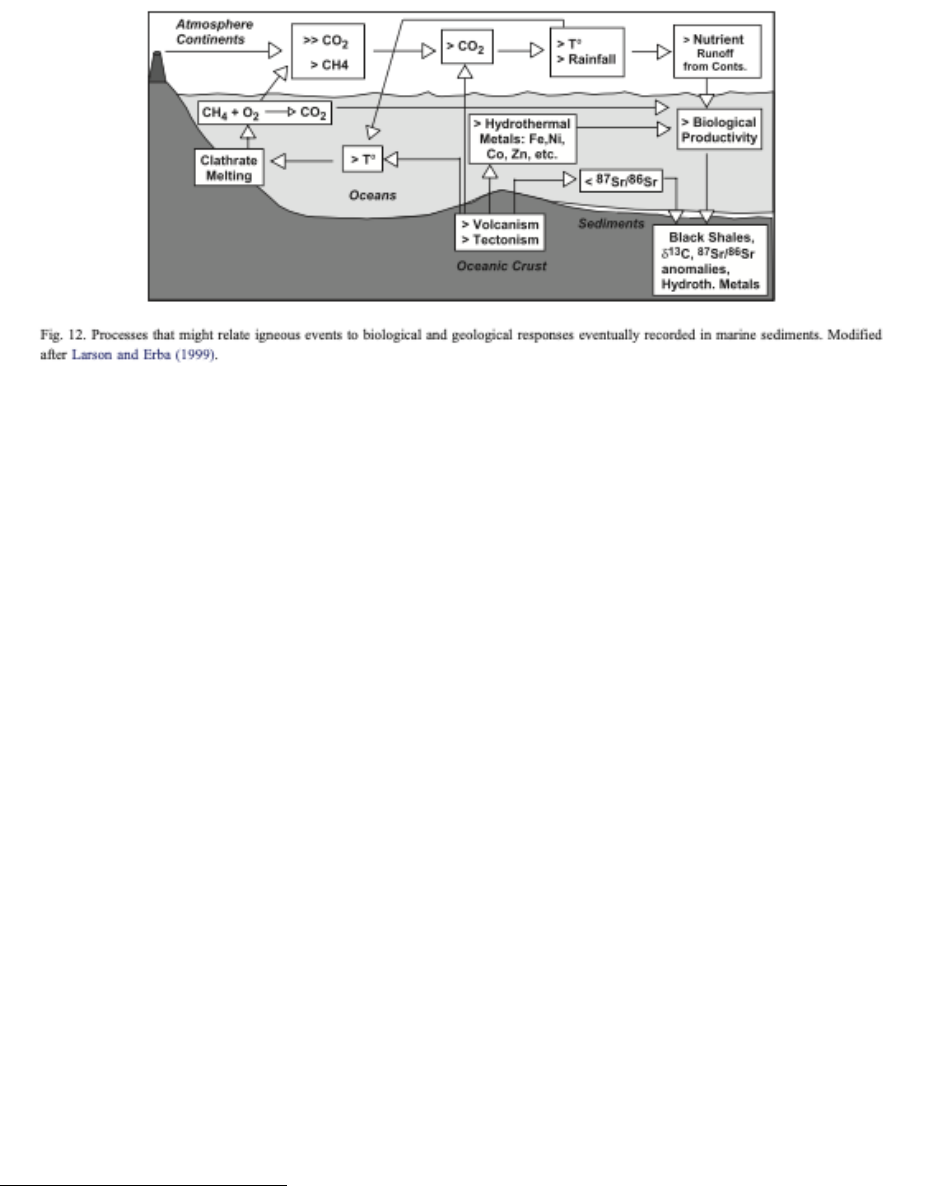
58
The above graphic
96
illustrates several undersea ongoing
volcanic events in the Mesozoic Era that caused global
temperatures to rise. These events have been the basis for CO2
claims in many studies. As the volcanism was ongoing, how
much weight should have been given to direct injection of
methane to the atmosphere? How much to direct warming of
the oceans by lava? How much to reverse causation – the warm
ocean expelling CO2? Models of paleolithic events suffer from
the same over-sensitivity as models of the modern climate, and
wider error ranges and other uncertainties as well.
The IPCC’s synthesis of the first two methods is shown in the
graphic below for policy makers, copied from page 13 of the
IPCC report. It shows that with continued additions of CO2 at
the same rate (scenario SSP3-7.0), warming of the earth by
2081-2100 will be 3.5ºC above the pre-industrial level — 2.5 C
greater than today’s. Since warming on land will be much
higher, this is enough warming to scare everyone!
96
https://scholar.google.com/scholar_lookup?&title=Calcareous%20nannofos
sils%20and%20Mesozoic%20oceanic%20anoxic%20events&journal=Mar.%2
0Micropaleontol.&doi=10.1016%2Fj.marmicro.2004.04.007&volume=52&pa
ges=85-106&publication_year=2004&author=Erba%2CE
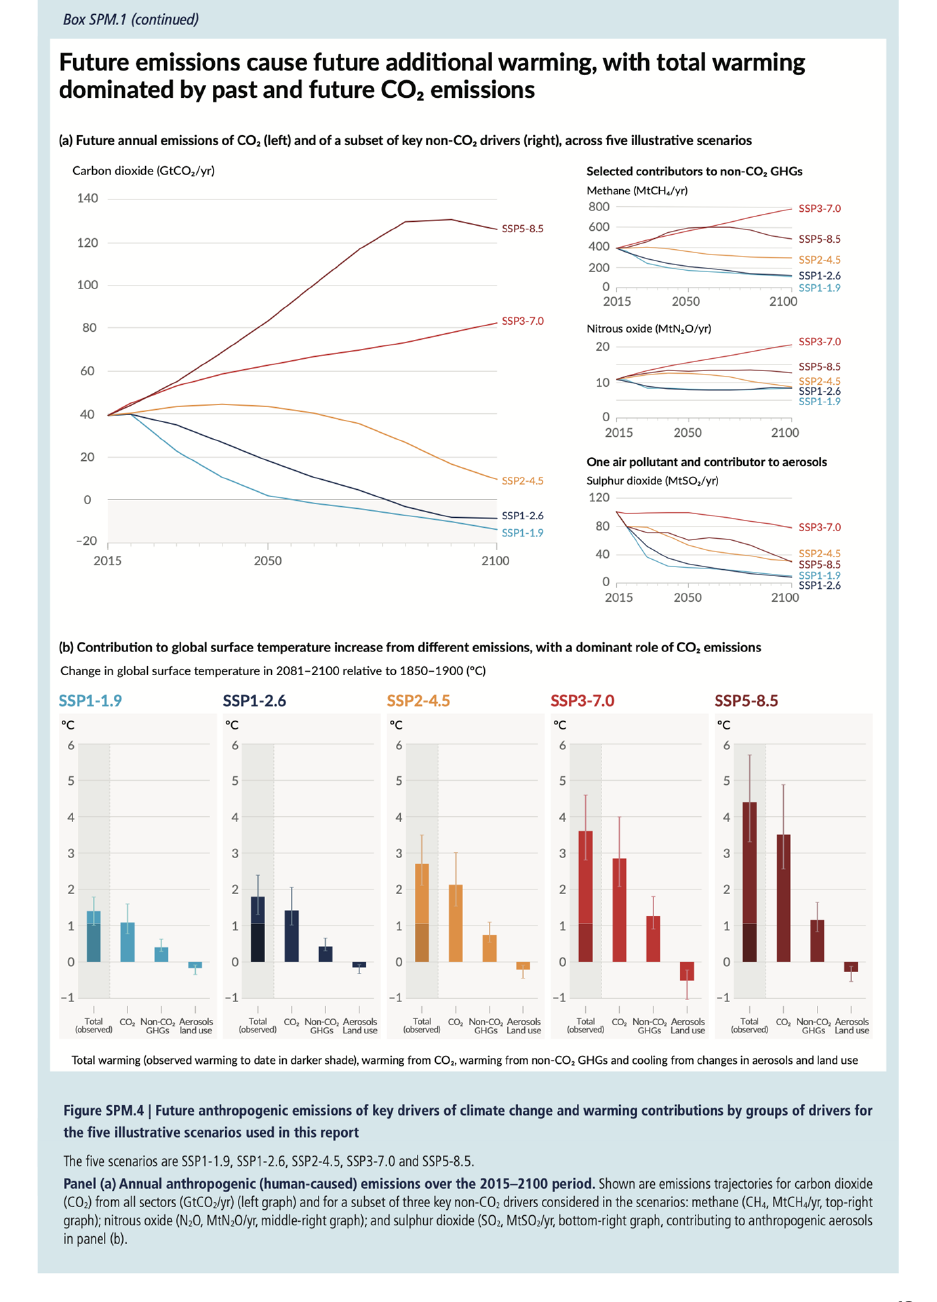
59

60
Based on my studies in this paper, I believe this
projection is far too high: The allocation to CO2 forcing
is probably 40% too high, and the climate sensitivity is
far too high as well.
My twentieth question: Can we measure climate change
forcings and sensitivity accurately enough to prove
anything?
I am afraid the answer is no.
These days, all atmospheric science is done using computer
models. Scientists input into their computer models their best
estimates of physical, chemical, meteorological and
oceanographic processes, worldwide. There are dozens of
complex climate models, some with millions of lines of code,
with the earth divided up into thousands of squares or cubes.
But these come up with very discrepant predictions.
No lay person can critique a model. Who knows if important
factors have been left out? Climate scientists outside the model
group, rather than critiquing an existing model, will create a new
one.
Most of the data used in climate science is uncertain. The
satellite measuring the earth’s incoming and outgoing radiation
budgets and gases are subject to adjustments
97
. How clouds
affect the earth’s reflectivity (albedo) remains highly uncertain
despite much research and is very important in models. What
goes on geothermically under the ocean surface is mainly
unknown (see discussion in My tenth question), the fixation of
carbon by phytoplankton could be much higher or lower, and
there is uncertainty in ocean surface temperature
measurements. The effects of aerosols and of methane are
uncertain. While the temperatures in 1850 and 2022 are known
with some accuracy, the amount of each forcing in these years
is not, including, in my opinion, that for CO2. The effect of a unit
of CO2 is particularly uncertain.
97
https://journals.ametsoc.org/view/journals/clim/31/2/jcli-d-17-0208.1.xml

61
Different models of future climate have a huge range of
predicted outcomes, and almost all past models have greatly
overestimated the amount of present global warming.
To exaggerate an effect, one does not put the base of a
chart at zero. If temperature charts were put at base
zero Kelvin (-276ºC), or close to it, you wouldn’t see the
tiny changes.
Average world temperature is about 290 Kelvin, so a one-degree
change in world temperature is roughly a one-third of a percent
change.
98
This is very important, because many climate
skeptics argue that a one-third percent change in total incoming
or outgoing radiation or any other any other factor cannot cause
climate change, but a one-third percent change in present
temperature equals about 1ºC.
All of the discussion of climate warming to date is about
an eventual possible one or one and one-half percent
change in the earth’s temperature. Global warming since
1920 has been 0.1C per decade or about 1/30 of a percent
per decade.
The small percentage change of 1/3% per degree C
makes temperature hypersensitive to forcing, and model
predictions unreliable.
A change of only 2% in a model’s total forcing for 2085
would impact temperature by 6ºC.
To confirm that small percentage changes of forcing cause large
temperature changes, I have considered known forcing changes
and their results. The most obvious is the winter summer
change in the earth’s temperature, discussed in My question six
above, which about 4ºC, simply because of more land to absorb
sunlight in the northern hemisphere. Next, consider
Milankovitch cycles, which are based upon a solar forcing
change of 10% more or less than average over 65º North at the
98
. Calculations in physics are done from the base of 0 Kelvin = -276º C. The earth’s average
temperature is about 15ºC, a difference of about 291º C, so 1 percent is 2.9º C and one-third
percent = 0.96º C

62
summer solstice
99
, where there is the most land — which is only
a tiny percent change worldwide over the year; and yet these
cycles are thought to have triggered ice ages.
Climate models are in effect equations with hundreds (or
thousands) of variables. It is well known that there are many,
many ways to adjust the inputs to such an equation to make it
fit a curve, especially a simple curve with only a beginning data
point in 1850 and an ending one in 2020 (and nothing reliable in
between because of ocean cycles). Thousands of divergent
climate models could easily be hind-cast to fit past climate data.
I reiterate, then, that climate models cannot make
reliable predictions.
My twenty-first question: What will the world’s average
temperature be in 2090?
In analyzing business investments, one of the world’s most
successful investors, Warren Buffet, eschews the use of
spreadsheets and complex projections which he finds
untrustworthy, relying instead upon past results and back of the
envelope calculations.
In that tradition, I offer my own back of the envelope projection
based upon past “results”, a projection so simple that anyone
can understand it. This projection is for worldwide temperature,
including the oceans. Land temperatures have been rising and
will continue to rise more rapidly.
I do believe in the adage: “I distrust all projections, especially
about the future.” A major unknown is how the ocean sink of
CO2 and ocean currents will react. Another is whether there will
be a VE7 or greater terrestrial volcanic eruption or a VE8
underwater one (with opposite effects). Another is whether
99
https://en.wikipedia.org/wiki/Milankovitch_cycles#/media/File:MilankovitchC
yclesOrbitandCores.png
63
there will be a “methane bomb” (see My seventeenth question).
Another is that phytoplankton remain active.
THE PROJECTION
I assume that human behavior doesn’t change — as in SPCC
scenario SPP 3 – 7.0 that I analyzed in a previous question.
Therefore, CO2, methane and nitrous oxide emissions are
assumed to continue at current levels.
The following should slow the temperature increase compared to
the past:
a) additional units of CO2 will have slightly less warming
effect (see the graph in the nineteenth question);
b) aerosols will not diminish further and will increase again
due to South Asian, Southeast Asian and African countries;
c) human-caused methane emissions will not continually
increase and add to its present warming impact.
The following should speed up the temperature increase
compared to the past:
a) sea ice and glaciers will melt faster, increasing albedo
more rapidly;
b) natural methane emissions will increase faster with
rising temperatures.
Therefore, on balance, temperatures will rise at the same
rate as in the past.
It impossible to use of temperature changes over a few decades,
due to fluctuations in the oceans and aerosols, so I will use the
warming over the last ~100 years, from 1920 until 2022. That
is 1ºC in total or just under 0.1ºC per decade.
It is 67 years from 2023, when I am writing this, until
2090, so temperatures will increase by about 0.7ºC.
What are my conclusions?
About global warming:
64
It is likely to continue, but much slower than crusaders fear.
Therefore, there will be more time to adapt and to find solutions
that are economically sound.
We should immediately give priority to controlling methane
emissions.
We should continue efforts to reduce carbon dioxide emissions.
About Nature:
I’ve always believed that even in our time we human beings are
ultimately insignificant before the forces of nature. I now add
under-ocean magma to to the extremely rare but possible
catastrophic dangers humanity faces.
About Science:
It seems that individual scientific creation, embodied by the
stars such as Newton, Einstein, the Curies and Pasteur, is
obsolete, Scientists no longer imagine or derive answers
themselves. They program. And computers give the answers.
Almost every conclusion, even those derived from “toy models”
needs computer computation.
Humans cannot readily check the appropriateness or accuracy
of computer computations or understand the inputs. Rather,
another computer is programmed by another scientist to see if
the same results emerge. If not, the results of all the models
are shown as bars on a chart. Somebody decides which
computation, or which average of them, to use. Must we accept
science on trust?
In a few years will artificial intelligence make the final decisions?
About environmental and Energy policy:
The following thoughts have entered my head while writing this
paper:
Most people will continue to ignore most of the environmental
damage they cause, even when they are aware of it.
Most people will not cut their lifestyles unless forced to, and
most people worldwide will continue to want more physical
65
goods and experiences. Regulations, therefore, will be possible
and effective only if they have a minimum impact on lifestyle.
In the future people will need more energy to provide for still-
increasing populations, to continue lifestyle improvements
worldwide and to repair or alleviate the damage already done to
the earth — for example to provide more water by desalinization
and above-ground distribution; to make more fertilizer and
alleviate the environmental damage from it; to cool hotter
homes; to replace or possibly to sequester carbon.
To my knowledge, there are only three sources of non-carbon
energy: energy conservation, the sun and the atom.
Energy is conserved by electric cars (and they have other
benefits); by insulation and reflective glass; by heat pumps; by
more efficient electrical generation, transmission and use; and
by other improved technology.
The sun’s energy can be harvested in many ways: by panels, by
wind turbines, by waves, by tides, by falling water, by biofuel.
The choice is a matter of lifecycle environmental impact,
economy and efficiency. The advantages and limitations of
each means are well known. The need for energy storage and
improved transmission to balance load is well known.
Green energy, in my opinion, cannot be sufficient to provide the
needed energy to replace, or even to limit carbon-based fuels.
In my opinion nuclear power has the necessary capacity and is
safe enough. I also believe that new nuclear technology will be
safer still, have less disposal issues, and eventually will be made
available at a reasonable cost.
The Executive Summary begins below.

1
EXECUTIVE SUMMARY
21 Climate Change
Questions
What is causing climate change?
How much will global temperature increase?
By David A. May
Comments@myclimatequestions.com
©2023
May be reproduced
with attribution.
Link to the full paper with data, explanation, and reasoning.
Could the presently accepted truth be wrong?
Yes, in my lifetime and throughout history generally
accepted scientific truth has proven wrong.
1. How rapidly has the climate been warming?
No doubt it has warmed about 1.0º or 1.1º C since 1850.
Temperatures have risen most over land in the Northern
Hemisphere and least in the tropics. As I write worldwide
temperatures have fallen 0.2ºC from their 1916 highs, but
an El Niño is pending. Temperatures will likely continue to
increase, but at a rate far less than the IPCC climate
authority predicts.
2
2. When climate skeptics doubt the temperatures used to
calculate warming, are they correct?
Yes. Recently measured land temperatures are too high by
0.1ºC due principally to the urban heat island effect.
Satellite near surface temperatures are accurate.
Temperatures measured before the satellite era began in
1979, are subject to many adjustments that are likely not
accurate, but they are the only temperatures we have.
3. Is the earth warming because we are still coming out of
the Ice Age?
No, although there is some cooling from remaining ice age
glaciers and sea ice.
4. Could a natural fluctuation explain current world
temperature changes?
Yes. World temperatures have fluctuated in preindustrial
times by at least 0.5ºC and probably more than 1.0ºC. The
temperature may or may not have been warmer than today
during the Roman and Medieval Warm Periods, but almost
surely was warmer in the Mesopotamian - Minoan period
5,000 to 8,000 years ago.
5. Are the impacts of climate warming thus far as bad as
they have been portrayed?
No, they are not as bad. There have been misleading or
false statements, photographs and movies. Hurricanes,
Tornadoes, coral reef bleaching, and western droughts are
not worse than before.
There are negative effects of rising temperatures, including
longer fire seasons, sea acidification, and faster sea level
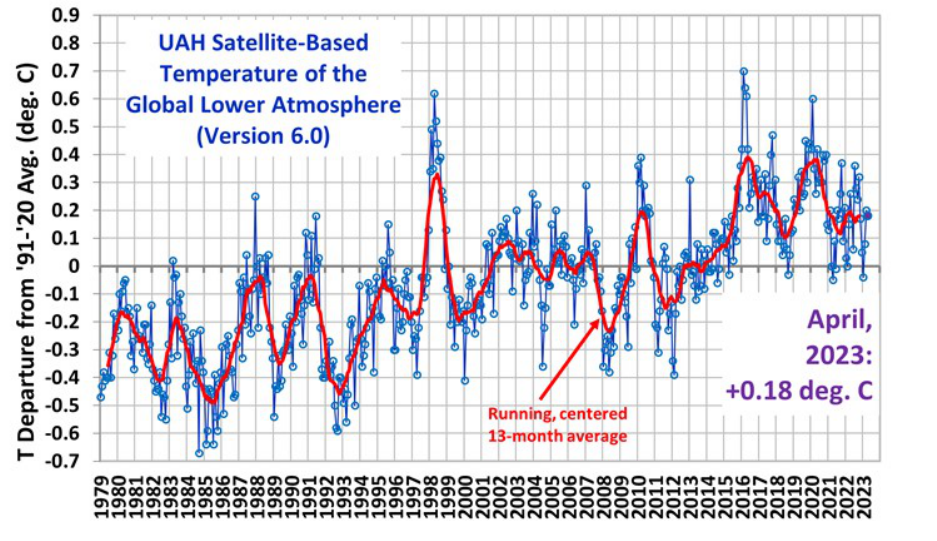
3
rise. Positive effects have been longer and more fertile
growing seasons and less dire winters in northern regions.
6. How large are the recent fluctuations in worldwide
temperature?
They are huge. Global temperatures sometimes vary from
their monthly averages by 0.4ºC and sometimes from year
to year by 1C. Temperatures rose between 1920 and 1940,
declined between 1940 and 1980, and rose again through
1916. The average global temperature is almost 4ºC
higher in July than in January.
7. Are solar fluctuations warming the climate?
Solar fluctuations can warm or cool the planet by a degree
C or more and may be partly responsible for the Little Ice
Age. However, in the 20th and 21st centuries they have
had little effect.
4
8. Is the heat that comes up through the crust of the earth
(not considering plumes and volcanos) affecting the
climate?
No. It has almost no effect.
9. Are Land Volcanos affecting the temperature?
Land Volcanos of VEI 6 or more have affected the climate in
the past by veiling the sun or injecting gases into the
stratosphere. Very rarely VEI 7 volcanoes they have cooled
the climate for years. In recent years volcanoes have had
little long-term effect.
10. Are Undersea Volcanos and magna plumes partly
responsible for present climate and climate change?
There is more than twice as much ocean as land. Only 5%
of the ocean floor has been and presently can be explored.
Tectonic plate separations mainly take place in the deep
ocean where the earth’s crust is much thinner than on
continents.
During the earth’s history there have been huge
outpourings of magna, one of which warmed the oceans to
38ºC (100F). Only a very large VEI 7 undersea eruption or a
highly unlikely VEI 8 eruption could warm the planet. There
are likely active volcanoes under the Arctic Ocean,
contributing to unexplained warming there, and off the
Antarctic coast. The 2021-22 Tonga eruption injected
water into the stratosphere and thereby warmed the earth;
this is the first recorded event of this nature.
11. Are fluctuations in winds and ocean currents sufficient
to affect average global temperatures?
Yes. Upwelling such as from La Niña and the Antarctic
upwelling can cool the climate, and the Pacific mixing (top)
5
layer can heat it — including by El Niño, but not limited to
it. Many ocean oscillations exist; some persist for decades.
Currents and winds fluctuate over short and long periods.
Scientists try to model the fluctuations, but most of them
consider the changes chaotic. The fluctuations make it
impossible to rely upon one- or two- decade changes to
predict future climate.
12. Has deforestation caused the climate to warm?
No, it is the opposite. Deforestation has cooled the climate
because forests absorb more heat from the sun than does
open land or crops, and because trees, it has recently been
confirmed, give off methane. These two effects outweigh
the CO2 sequestration of old forests.
13. What are the effects of human-caused aerosol emissions
into the air?
Human-caused aerosols (microscopic liquid drops or
particles in the air) — particularly the aerosol sulfur dioxide
— on balance substantially cool the climate by reflecting
sunlight and by seeding clouds. The worldwide
temperature decline between 1940 and 1980 is due to large
increases in aerosols, and half of the warming from 1980
until present is arguably due to the aerosol decreases since
Clean Air Acts in the United States and Europe. Reducing
black carbon emissions have allowed increasing amounts of
sunlight to reach the earth’s surface, rather than heating
the upper troposphere.
The global climate authority, the IPCC, mistakenly has
aerosols substantially increasing from 1980 to the present,
which causes at least 35% overestimate of CO2’s effect.
14. Why and how do greenhouse gases affect the earth’s
temperature?
From the top of the troposphere heat can only proceed to
space by radiation. The earth’s infrared radiation photons

6
heading towards space are interrupted and absorbed by
greenhouse gas molecules and emitted in all directions —
only a fraction towards space. Different greenhouse gasses
absorb and emit different wavelengths of the earth’s IR
radiation. Many infrared photons head back to the surface
of the earth, where they are absorbed. This is not felt
because the returning radiation is less than the radiation
being emitted by the earth.
15. What effect do individual greenhouse gases have on
temperature?
CO2, the most prevalent human-affected greenhouse gas
by far, has a very weak effect, designated 1, but a very long
life of many hundreds of years. Consequently, excess
human-caused emissions cumulate in the atmosphere.
Global warming potentials, shown in the chart below,
measure the relative effect of other greenhouse gases by
weight compared to over a 20 or 100 year time period.
In
molecule
s parts
per
billion
molecule
s in
atmosph
ere
~2022
Lifetime
(when
about
35% of
the gas
remains.
Immediate
Radiative
Efficiency
in watts
per square
meter
(equal
number of
molecules)
Relative
weight
of a
molecul
e of the
gas
compar
ed to a
molecul
e of CO2
Comparati
ve
Immediate
Radiative
Efficiency
in watts
per square
meter by
equal
weight =
immediate
warming
potential
20 Year
Global
Warming
Potential
(by
weight)
100 Year
Global
Warming
Potential
(by
weight)
CO2
411,000
very
long 100
- 1000
1.37
1
1
1
1
Methane
1893
12
330 - 420
2.74
120 -156
83
30
Nitrous
Oxide
334
114
300
1
300
273
273
Ozone
337
short
300
NA
NA
NA
NA
7
16. How much are fluctuations in Ozone affecting the
climate?
Ozone pollution at ground level is a significant greenhouse
gas, about 10% of all atmospheric ozone. The ozone layer
has partially recovered, but the recovery has stalled.
The ozone layer, which is mainly in the stratosphere, and
which is created by UV from the sun modifying oxygen,
filters out most UV-B. Oxygen molecules themselves filter
out almost all UV-C. UV-A, near visible light, makes it to the
earth’s surface. The ozone layer has little effect on world
temperature because it filters incoming UV on the one hand
and acts a greenhouse gas on the other.
17. What about future warming from methane?
Methane emissions have been estimated by ground
monitoring. My research indicates that the amount of
methane emitted has been greatly underestimated. A
methane spotting satellite set to launch in 2024 will provide
better data. My research also suggests that the warming
effect of methane breakdown has been underestimated.
Therefore, because methane has made a greater
contribution to climate warming, the contribution of CO2
must have been less, by perhaps 10%. Methane emissions
from natural sources are increasing rapidly, probably due to
increased land temperatures.
18. What has been the warming effect of carbon dioxide
(CO2)?
Excess CO2 is entering the atmosphere each year because
the carbon cycle balance has been disturbed, primarily by
emissions from fossil fuels production and use. The oceans
have absorbed one-half of the excess CO2. At the present
rate of emissions, CO2 will double from the pre-industrial
levels of 1850 in about 2065.
8
There is only a 10% correlation — virtually nil — between
two-decade CO2 levels and the corresponding temperature
changes. If the temperatures are adjusted to account for
aerosol fluctuations, the correlation turns negative. One
must conclude that events in the ocean have a far
greater effect over two decades on temperatures
than CO2.
Given what I have learned in previous questions, the
IPCC’s attribution of historic global warming to CO2
should be reduced by at least 40%.
19. How has the IPCC predicted future temperatures?
I don’t believe the results published by the IPCC, or of any
comparable modelling method, are reliable. However,
since this is the method the climatology world uses, it is
worth understanding it: First, one calculates a forcing in
Watts per square meter for each greenhouse gas and other
human forcing elements. Then one adjusts the total by the
positive and negative feedbacks of the climate system, and
finally one multiplies this by a “sensitivity of temperature to
Watts per square meter.
The period from 1850 to the present, or some Paleolithic
period is then used, to calibrate the sensitivity. Next. one
projects forward using the sensitivity and future projected
emissions under various scenarios.
Under the scenario where emission rates of CO2 don’t
change the IPCC projects a a warming of 2.5ºC (4.5ºF)
from today for the 2080 to 2100 period. Since land
warming would be higher, this is a scary projection. For the
reasons discussed in previous questions and others, I
believe the projection is far too high.
20. Can we measure climate change forcings and sensitivity
accurately enough to prove anything?
9
No. All climate science today uses computer models of all
physical, chemical, meteorological. and oceanographic
influences worldwide. There are dozens of these models by
different scientific groups — some with millions of lines of
code — and no outsider can analyze all the inputs or
calculations. The models have a very large range of
temperature outcomes and climate sensitivities. Almost all
the input data is uncertain.
Celsius temperatures exaggerate temperature changes.
The base of zero for a graph without exaggeration is 0
Kelvin, -276C or thereabouts. A change of 1ºC is a 1/3%
change in the earth’s temperature. On the one hand, then,
small changes in forcing can affect temperature, contrary to
what some climates skeptics have argued; and on the other
hand, temperature is hyper-sensitive to changes in overall
forcing — such that a 2% change in total forcing would
cause a 6ºC change in temperature. This hyper-sensitivity
and the uncertainty of inputs makes the output of all
models unreliable.
21. What will the world’s average temperature be in 2090?
In analyzing business investments, one of the world’s most
successful investors, Warren Buffet, eschews the use of
spreadsheets and complex projections which he finds
untrustworthy, relying instead upon past results and back of the
envelope calculations.
In that tradition, I offer my own back of the envelope projection
based upon past “results”, a projection so simple that anyone
can understand it. This projection is for worldwide temperature,
including the oceans. Land temperatures have been rising
faster and will continue to rise more rapidly.
However, I do believe in the adage: “I distrust all projections,
especially about the future.” I list some of the known unknowns
in the main paper).
THE PROJECTION:
10
I assume that human behavior doesn’t change — as in SPCC
scenario SPP 3 – 7.0 that I described in a previous question.
Therefore, CO2, methane and aerosol emissions are assumed to
continue at current levels.
The following should slow the temperature increase compared to
the past:
1. additional units of CO2 will have slightly less warming
effect (see the graph in the nineteenth question);
2. aerosols will not diminish further and will increase again
due to South Asian, Southeast Asian and African emissions.
3. human-caused methane emissions will not continually
increase and add to its present warming impact.
The following should speed up the temperature increase
compared to the past:
a) sea ice and glaciers will melt faster, increasing albedo
more rapidly;
b) natural methane emissions will increase faster with rising
temperatures.
Therefore, on balance, temperatures will rise at the same
rate as in the past.
It impossible to use of temperature changes over a few decades,
due to fluctuations in the oceans and aerosols, so I will use the
warming over the last ~100 years, from 1920 until 2022. That
is 1ºC in total or just under 0.1ºC per decade.
It is 68 years from 2022 until 2090, so temperatures will
increase about 0.7ºC.
What are my conclusions?
About global warming:
It is likely to continue, but much slower than crusaders fear.
Therefore, there will be more time to adapt and to find solutions
that are economically sound.
11
We should immediately give priority to controlling methane
emissions.
We should continue efforts to reduce carbon dioxide emissions.
About Nature:
I’ve always believed that even in our time we human beings are
ultimately insignificant before the forces of nature. I now add
under-ocean magma to the extremely rare but possible
catastrophic dangers that humanity faces.
About Science:
It seems that individual scientific creation, embodied by the
stars such as Newton, Einstein, the Curies and Pasteur, is
obsolete, Scientists no longer imagine or derive answers
themselves. They program. And computers give the answers.
Almost every conclusion, even those derived from “toy models”
needs computer computation.
Humans cannot readily check the accuracy of computer
computations or understand the inputs. Rather, another
computer is programmed by another scientist to see if the same
results emerge. If not, the results of all the models are shown
as bars on a chart. Somebody decides which computation, or
which average of them, to use. Must we accept science on
trust?
About environmental and Energy policy:
The following thoughts have entered my head while writing this
paper:
Most people will continue to ignore most of the environmental
damage they cause, even when they are aware of it.
Most people will not cut their lifestyles unless forced to, and
most people worldwide will continue to want more physical
goods and experiences. Regulations, therefore, will be possible
and effective only if they have a minimum impact on lifestyle.
In the future people will need more energy to provide for still-
increasing populations, to continue lifestyle improvements
worldwide and to repair or alleviate the damage already done to
the earth — for example to provide more water by desalinization
12
and above-ground distribution; to make more fertilizer and
alleviate the environmental damage from it; to cool hotter
homes; to replace or possibly to sequester carbon.
To my knowledge, there are only three sources of non-carbon
energy: energy conservation, the sun and the atom. Green
energy and conservation, in my opinion, cannot be sufficient to
provide the necessary world energy needed to replace, or even
to limit carbon-based fuels. In my opinion nuclear power has the
necessary capacity and is safe enough. I also believe that new
nuclear technology will be safer still, have less disposal issues,
and eventually will be made available at a reasonable cost.