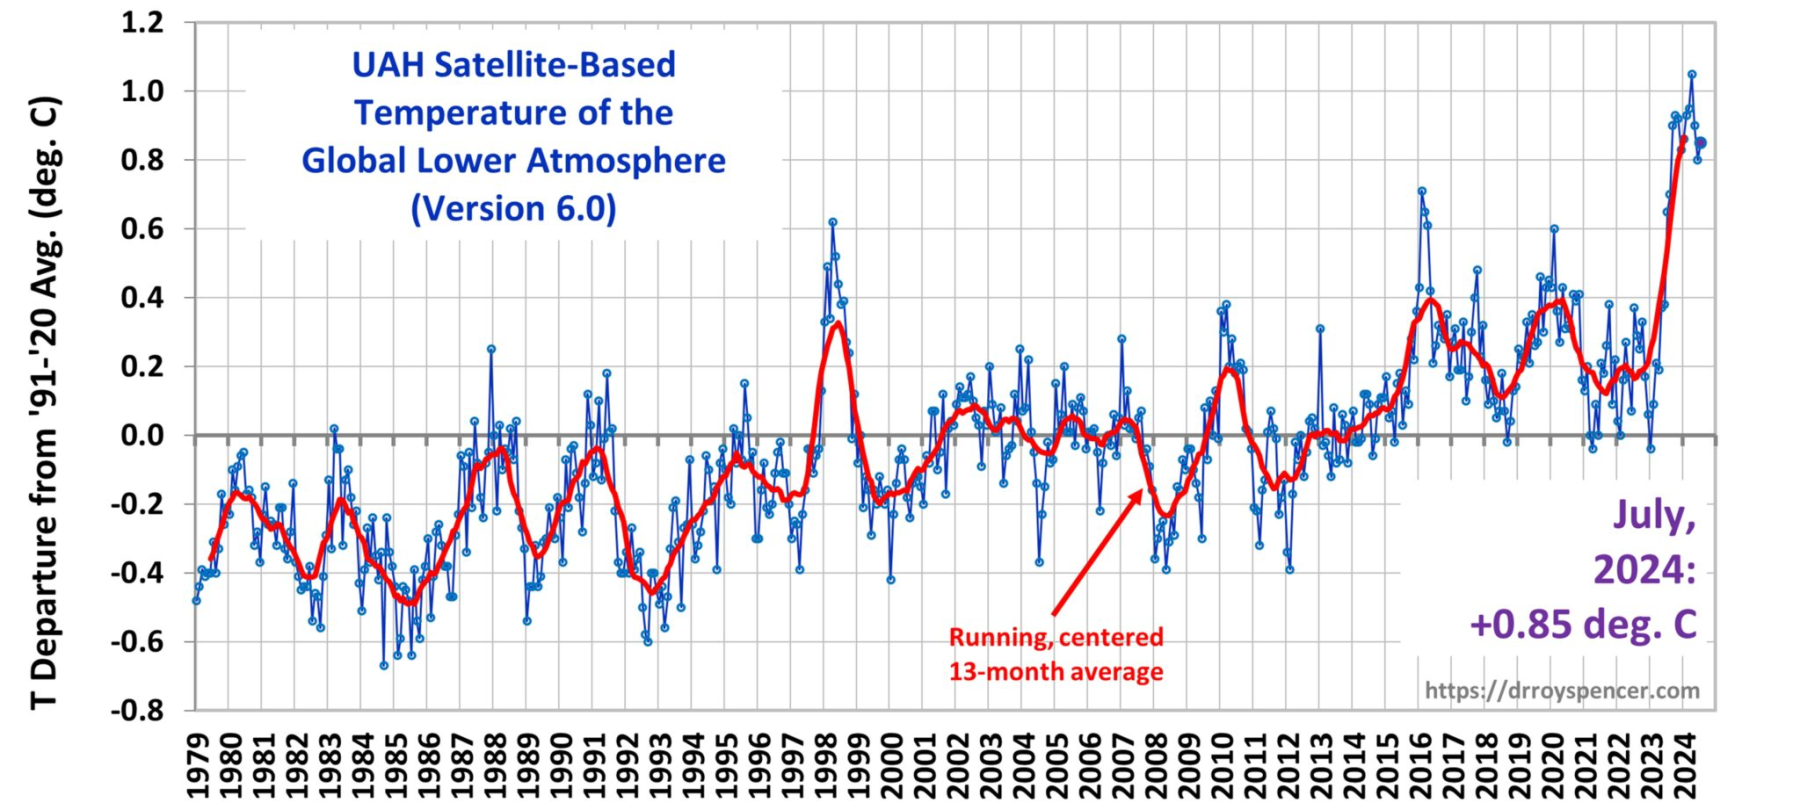
The temperatures in the chart below are anomalies, that is how much the temperature in any month differs from the average for that month for the period 1991 to 2020. Although, obviously, the general trend is up, there are huge swings up and down, in some cases as much as 0.8º C (1.4º F). Before discussing this, I would like to show the graph for the much larger annual swing of the earth’s temperature of 3.7ºC:
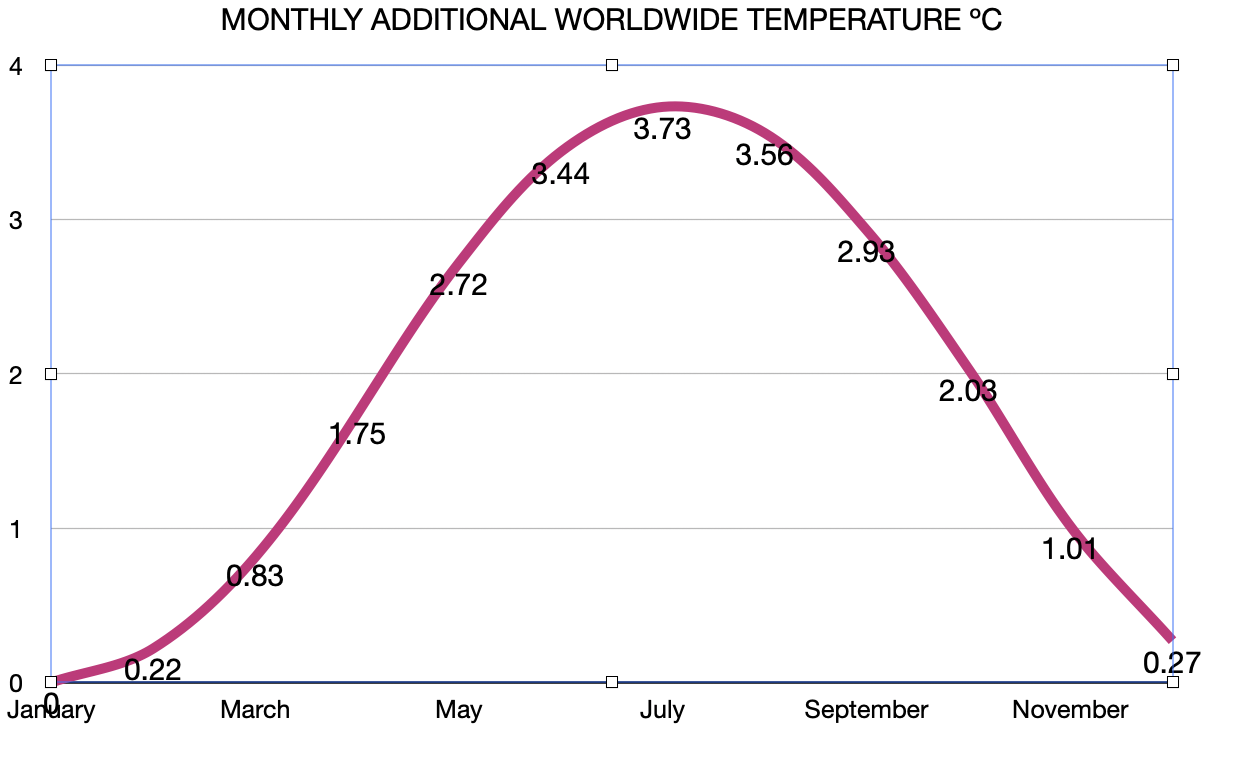
This swing in temperatures is because there is 35% more land in the northern hemisphere, and land does not retain heat as well as oceans.
In another question I discuss how sparse our sampling is below the ocean surface and how we know almost nothing about the deep ocean under 2,000 meters. We do know that ocean surface temperatures shift dramatically from year to year, even month to month, but we cannot predict the timing of the shifts, or in many cases the reasons. For example, between March of 2020 and March of 2021 the satellite measured temperatures of the air above the oceans worldwide cooled by 0.41ºC (0.31ºC north of 20ºN, 0.61ºC in the tropics, and 0.67ºC south of 20ºS). And those March 2021 temperatures worldwide were 0.29 C below the January and February temperatures of that year.1 Would you like me to explain? I can only guess: There must be massive currents coursing through the oceans that nobody has heard of.
We do know about certain oscillations. The most famous is the El Niño Southern Oscillation (ENSO),2 that describes an alternation between calm, El Niño and an upwelling, La Niña, off the coast of South America. It has no name when the upwelling is moderate. El Niño takes place when the westerly trade winds that normally are weak blow sun-heated surface water away from the South American coast. Cold water at the South American coast is denser and therefore heavier than warm surface water, but when the surface water is removed, colder water will upwell to replace it or Cold water at the South American coast is denser and therefore heavier than warm surface water, but when the surface water is removed, colder water will upwell to replace it or arrive by the cold northward current along the South American coast from the Antarctic, where it is replaced by deeper water. Even though ENSO has been unpredictable, this has not stopped oceanographers from creating models; there are many of them.
The strongest El Niño and La Niña events have been correlated with increases and decreases of worldwide temperatures. Very strong El Niños are followed the same and next year by 0.1º to 0.2º C increases in worldwide temperatures and very strong La Niñas by 0.3º C decreases. The average temperature of the tropical seas where El Niño and La Niña occur are 22-28º C3; while the average temperature of the earth’s land is 8.6º C.4 The data I have looked at (my calculations) show that land temperatures increase more than ocean temperatures by very roughly 2.5 times during and after strong El Niños, and that they decrease more than ocean temperatures by about 1.8 times during strong La Niñas.
The “reservoir” for El Niño water is the western Pacific. In normal and La Niña years, the trade wind and the equatorial current push warm water to the western pacific near Borneo, where it literally “piles up” and also becomes deeper. The mixing layer is much thicker in the western Pacific, as was illustrated in the graphic above; it can vary from 100 to 300 meters in depth. Recent studies find it has gotten deeper and more stratified. The western Pacific mixing layer can warm the planet if it spreads out. I have only seen this discussed very recently, but it is in fact rather obvious. An animated graphic of sea surface temperatures from month to month over many years shows than in warmer years the high temperature layer on the surface is expanded — north and south, and sometimes west all the way to the Indian sub-continent, sometimes at the same time as it has spread east in El Niños.
Temperature readings are taken from the very top skin of the ocean, and it is this layer that transfers heat to the winds. (The tropical ocean is warmer, on average, than the air above it.) So, it is evident that hotter temperatures worldwide can arise from the mixing layer of the ocean — whether caused by the movement of water by winds or by the pressure of deep ocean currents.
There are many other powerful upwelling oscillations, as well as large fluctuations in ocean currents, all of which have a strong effect on regional and world climate.5 Many of these occur in areas that have poor historical records and are only being considered today.
Variations in upwelling, in ocean currents and surface spreading, and in the winds that affect them surely are responsible for most year-to-year fluctuations in the earth’s temperature, and they may also alter the climate for decades or longer. If the warming of the ocean surface is causing a weakening of ocean currents, as is postulated, it does not bode well for the earth’s temperature.
- A description of the upwelling processes is here: https://en.wikipedia.org/wiki/Upwelling ↩︎
- A description of the upwelling processes is here: https://en.wikipedia.org/wiki/Upwelling ↩︎
- https://www.cen.uni-hamburg.de/en/icdc/data/ocean/hadisst1.html ↩︎
- https://berkeleyearth.org/data/ ↩︎
- https://www.whoi.edu/know-your-ocean/ocean-topics/how-the-ocean-works/ocean-circulation/el-nio-other-oscillations/ ↩︎