You can read endlessly about carbon dioxide sources, sinks and interrelationships in the IPCCs Science report,1 Chapter 5, but here I am concerned only with total emissions. The following graphic 2 from NASA in 2012 gives an overview of the “fast carbon cycle”: (The slow carbon cycle takes millions of years.)
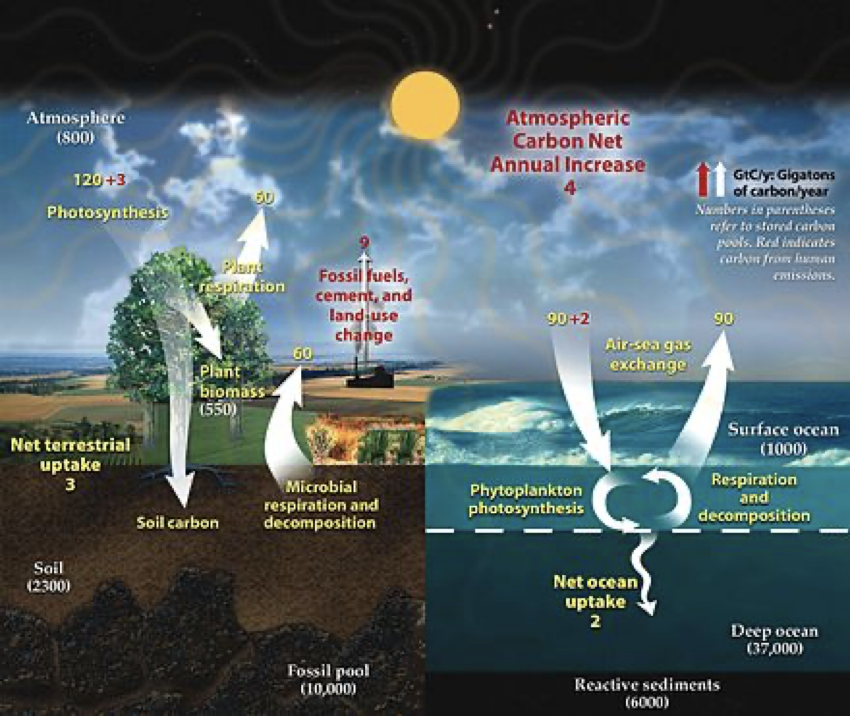
This diagram of the fast carbon cycle shows the movement of carbon between land, atmosphere, and oceans. Yellow numbers are natural fluxes, and red are human contributions in gigatons of carbon per year. White numbers indicate stored carbon. (Diagram adapted from U.S. DOE, Biological and Environmental Research Information System.). Note that the above diagram is representative and from 2012, can CO2 emissions worldwide have increase about 10% since then3 For instance, phytoplankton are recently considered to have a bigger role than previously thought.
Plant and microbial fluxes are mainly in balance (because the earth’s temperature adjusted long ago to create the balance), while almost one-half of the human contribution in the industrial age causes a net atmospheric increase of CO2 of about 1/2 percent per year (and the rest is slowly acidifying the ocean).
As far back as 1896 a Swedish scientist calculated that doubling CO2 levels in the atmosphere would cause world temperatures to rise 5ºC. But scientists generally believed that other influences were stronger such as the sun, and that the ocean was a sufficient sink for CO2 gas. This turned out not to be the case. Absent any other credible explanation, and also considering the centuries-long life of the CO2 being added to the atmosphere, almost all climate scientists have bought into the CO2 hypothesis.
How fast has carbon dioxide (CO2) been increasing? When will it double from the 1850 level?
The time of doubling is most often the time that the IPCC (intergovernmental climate authority) issues prediction for.
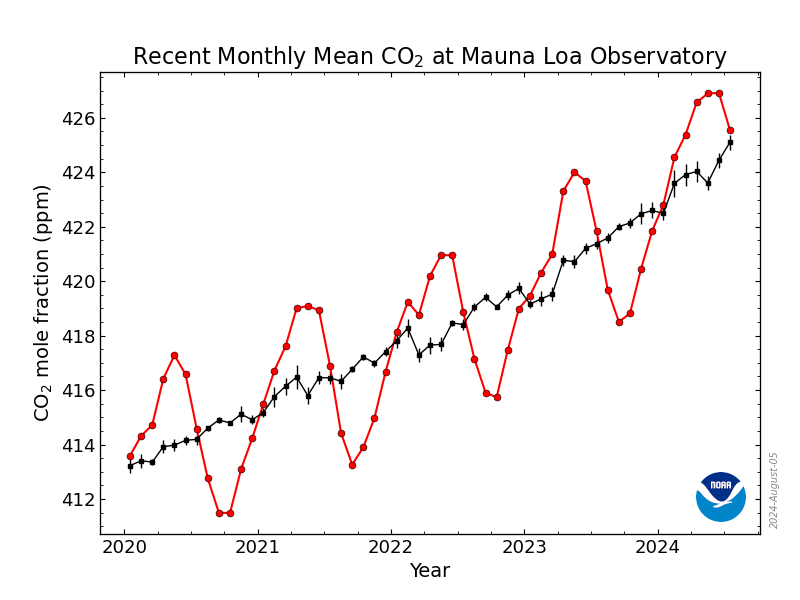
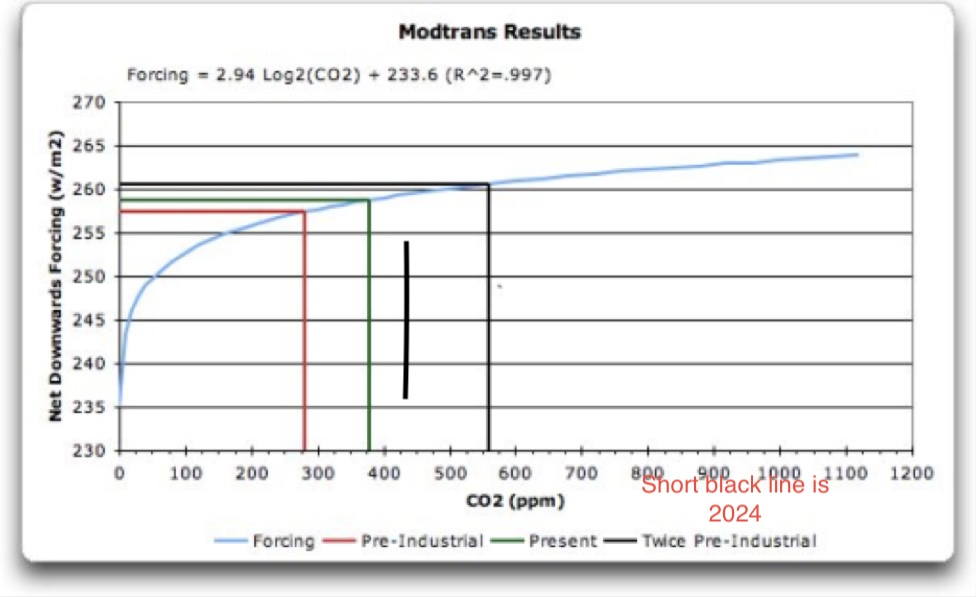
1850 CO2 levels were 280 parts per mllion. So, a doubling would be 560 ppm, as illustrated in the above graph4. The green “present’ line on the graph appears to be from 2007. Levels are now (July 2024) roughly 424.9 ppm, as illustrated by the short black line I added. Thus, we are 140 PPM away from a doubling of pre-industrial CO2 levels. The present rate of increase has been 1/2 of a percent, which would cause doubling to occur in 2079. But is seems to be accelerating. If the increase is .0075% per year rather than .005 per year, the year of doubling will be 2072. As illustrated in the graph, each additional quantity of CO2 has less effect because the central part of the absorption spectrum is already saturated (the calculations are complicated and disputed).
Thus, the amount of forcing (measured in watts of effect on temperature per square meter) estimated for CO2 and used in climate calculations (and given a value of 1) is questionable. The instantaneous forcing of every other gas and aerosol is known with much greater certainty than for CO2, because the amount of forcing per molecule is many times larger, and because the other greenhouse gases are not saturated in the atmosphere or in conflict with water vapor. In other words, the forcing from CO2 is very difficult to measure. Furthermore historical forcing measurements are confounded by misestimation of aerosols, and, in my opinion, methane. It could well be that total CO2 forcing is not that much greater than that of methane. In a one hundred year time frame, however, CO2 is more important than methane, because the later fades to near zero. It is worth remembering, however, that fossil fuels are a main anthropogenic source of both greenhouse gases.
- https://report.ipcc.ch/ar6/wg1/IPCC_AR6_WGI_FullReport.pdf ↩︎
- Graphic from: https://earthobservatory.nasa.gov/features/CarbonCycle ↩︎
- https://www.statista.com/statistics/276629/global-co2-emissions/ ↩︎
- Modtran is modelling software developed by Spectral Science. I cannot locate this particular image from around 15 years ago. ↩︎