Methane is important as being the second strongest contributor to greenhouse warming. The official 100 year warming potential is 28 and the 20 year warming potential is about 83 and when initially emitted it is about 156 times that of an equal weight of CO2. I believe the warming potentials are underestimated by at least 15 % because they do not include effects in the stratosphere. The reason methane’s warming potential declines rapidly is that its half-life is short, about 8 years, so less than 20% remains in 20 years and far less than one percent remains in the lower atmosphere in 100 years. In other words, almost all of methane’s effect is concentrated in the first years . Methane is destroyed by the hydroxyl molecule (OH) which is most prevalent in the tropics.1
As mentioned in the paragraph above, methane is found in the stratosphere — at all levels. It is transported there by the Brewer-Dobson circulation (the current that rises at the equator and falls at the poles), which has been increasing with warmer temperatures. Because there is much less water vapor in the stratosphere than in the tropics, methane has a longer half-life. Thus it increases global warming additionally. Eventually UV radiation will cause the methane (CH4) to brake down into one carbon dioxide (CO2) molecule and two water vapor molecules (H2O). The warming potential of the methane and the associated water vapor is significant.2 3
The sources of methane emissions:
The Methane Budget graphic below is copied from the IPCC Climate Change 2021 The Physical Science Basis, and is based upon old and probably inaccurate data4.
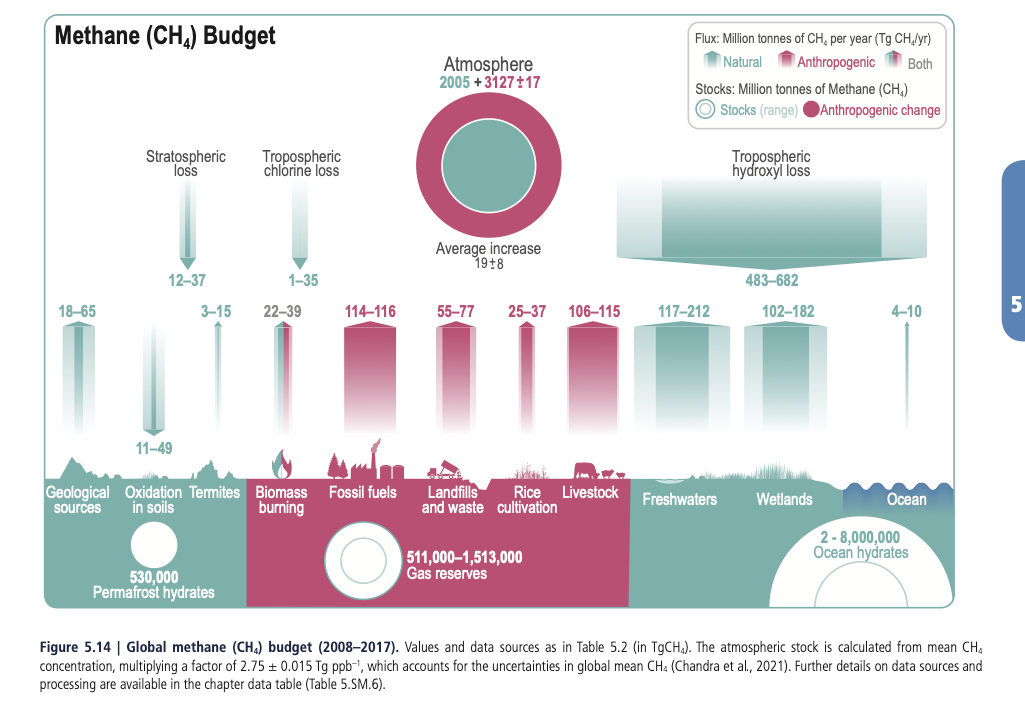
As shown above, major sources of methane are natural gas, petroleum and coal, cattle, sheep, goats, termites, bacterial action in landfills, agricultural waste, wetlands, volcanos, undersea vents, and forest fires. Not shown is the methane emitted by forests. Since 2020 satellite sensors have shown humongous emissions of methane from uncapped gas production. Potential emissions are from the huge amounts of methane are trapped in polar methane-ice and frozen peat.
Scientists are concerned because the growth rate of methane is accelerating. The acceleration has been attributed to various sources, for example increased use of fossil fuels, more agriculture, more outgassing from wetlands and polar reservoirs due to higher temperatures, and/or a diminishing amount of methane sinks per unit of methane emitted.
Some individuals fear a runaway increase of methane, often called a “methane bomb”. These increases might occur if increased methane or carbon monoxide or other hydrocarbons decrease the amount of OH available to destroy the methane in the atmosphere, or from the melting of the permafrost, or from increased temperature’s vastly accelerating emissions from wetlands.
The present rate of increase of Methane
The charts below are from the Global Monitoring Laboratory5, compiled from Readings at Moana Loa in Hawaii and an Arctic and southern hemisphere site. The total methane levels are slightly higher than those from the Greenhouse Observing Satellite (GOSAT)6.
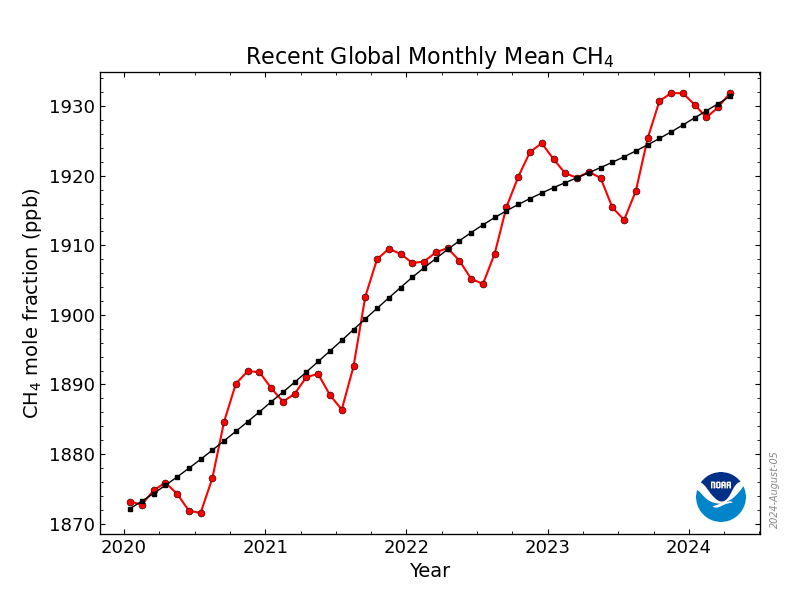
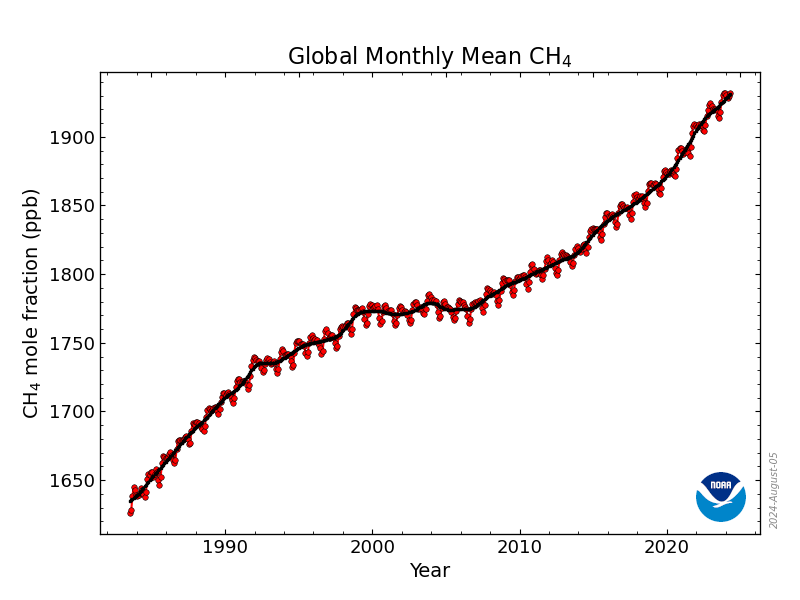
The level of NH4 increases by about 1% a year, while the yearly fluctuation of increases is also 1% of the atmospheric level. The seasonality of the rise, September through December, indicates to me that the decay of summer growth is a principal influence that overcomes a slow decay of existing methane gas. Below is a chart from the Global Monitoring Laboratory of methane growth since the early 1980s.
As I have emphasized on the home page of this site, we must give high priority to reducing methane emissions!
- The hydroxyl molecule is formed by UV radiation acting upon water vapor and ground-level ozone. The hydroxyl molecule will react more rapidly with N02 an CO (carbon monoxide), so it is possible that, if these increase. methane’s half-life could be extended. ↩︎
- https://agupubs.onlinelibrary.wiley.com/doi/full/10.1029/2020JD032752# ↩︎
- https://www.science.org/doi/10.1126/science.1182488 ↩︎
- https://report.ipcc.ch/ar6/wg1/IPCC_AR6_WGI_FullReport.pdf Section 5.2.25 page705 ↩︎
- https://gml.noaa.gov/ccgg/trends_ch4/ ↩︎
- https://www.gosat.nies.go.jp/en/recent-global-co2.html ↩︎